Has Truckload Capacity Improved Since “The Perfect Storm” of 2014
Additional capacity is not being brought on, as carriers are not betting on the come, they were burned in the Great Recession and they will not repeat the pain.
Back in April, IDS published a blog entitled: Evidence Truckload Capacity Crunch Is Here - Plan Ahead for Success.
The essence of the blog was truckload capacity may finally be tightening and the perfect winter storms of 2014 provided a glimpse of what is to come, while also sharing strategies for shippers to explore to help reduce the pain in their supply chain.
The information provided in the April blog is still relevant.
At some point, analysts may even reference the 1st quarter of 2014 as the tipping point where the truckload market dynamics began to shift.
Five points referenced in the April blog have played out fairly close to the prediction, which this blog explores further.
Even if you are not a believer that the capacity crunch is at its tipping point, hopefully this blog will help provide evidence 53’ capacity prices are on the rise, so you can prepare now to minimize the impact.
1. Pent up demand from the winter storms will carry 53’ capacity concerns and elevated prices through the rest of the year.
In looking at the CASS truckload graph, which measures the change in the cost per mile, along with the DAT spot demand chart for truckloads it appears the prediction of elevated rates for the year are playing out within the truckload market.
Cass Truckload Linehaul Index™
A measure of changes in per-mile truckload linehaul rates
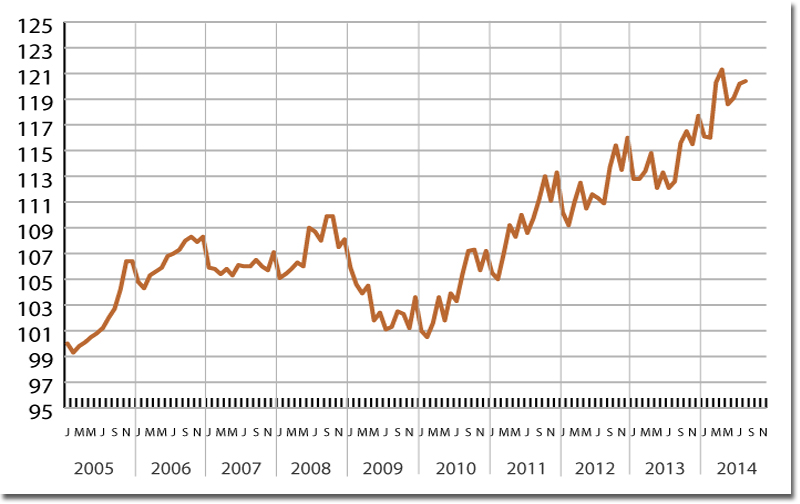
©2014 Cass Information Systems, Inc. and Avondale Partners
The CASS index typically experiences a steadiness or tapering of pricing at the beginning of the year, then moves upward through the remaining months. This trend did not play out in the 1st quarter of 2014, as rates have continued to rise, although had a slight breather in May and June.
DAT Spot Demand
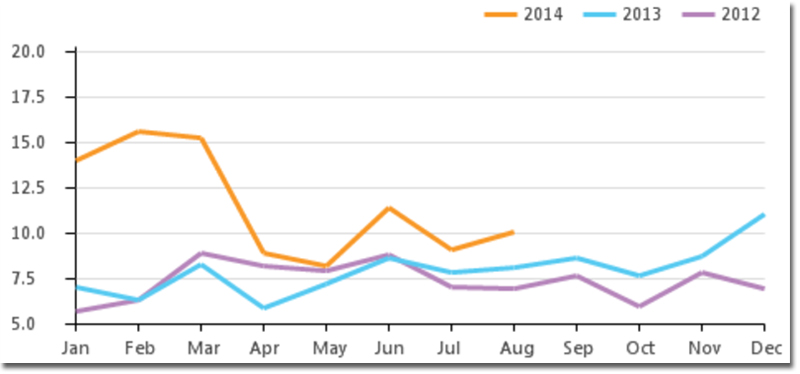
Copyright © DAT Solutions. All rights reserved
The DAT spot demand chart represents the number of loads posted against trucks available. The 1st quarter numbers indicate unprecedented demand, with some relief in April and June, but is again on the rise. The peak demand in the DAT chart occurred over the same period the CASS index experienced the largest increases.
Intermodal also broke prior year trends, as seen in the JOC/IDS Intermodal Spot Index. The intermodal index chart included within this blog measures the change in rates using January 2012 as the baseline.
Intermodal Index Price Change

The chart illustrates intermodal spot rates spiked higher in the 1st quarter than in the previous year’s “peak season”. While spot intermodal rates did decrease through the end of July, the trough is only 3.8% below the highest point last year. With that said, there is potential the spot rate market could really explode with a slight increase in demand.
The long and short of it is rates did increase and have remained elevated.
2. The economic recovery is showing more life and promise to drive up the demand for 53’ capacity.
Industrial Production Index is probably a better indicator of freight than GDP, since GDP pulls in service businesses. In looking at the IP Index, we see it continues to pick up steam, as is illustrated in a graph from the St Louis Federal Reserve office.
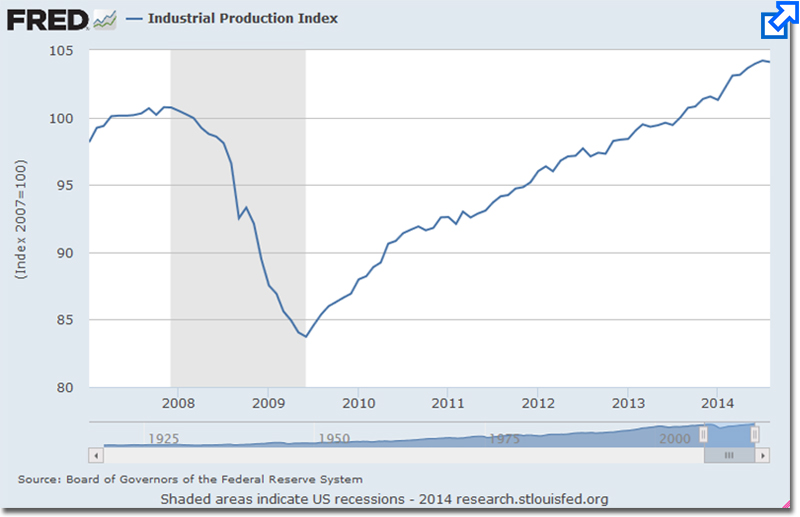
The upward trend began in August of 2013, when the index hit 2007 levels for the first time. The IP Index continues to increase with the latest reading coming in at 104.1, with 100 being the 2007 baseline.
3. Lost productivity that occurred because of the 2014 winter storms cannot be recovered, but will be accounted for in future pricing.
This topic is illustrated in the prior conversation on elevated pricing previously outlined above.
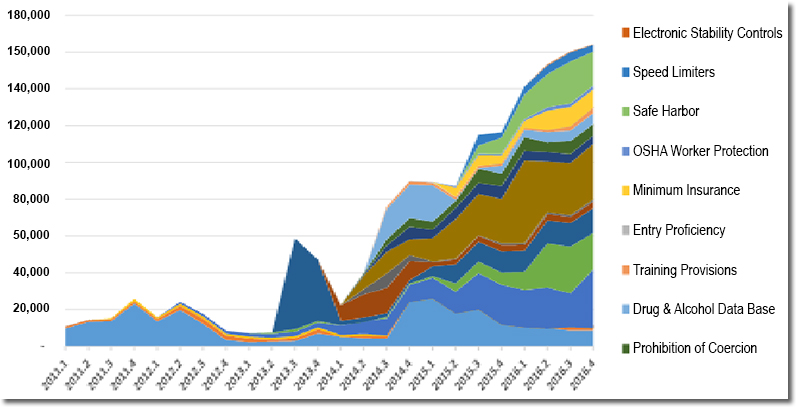
4. Driver shortage that is not going to end anytime soon.
The chart off to the right says it all. Regulations continue to reduce truckload productivity; make it difficult to hire; and reduce the drive pool. From our perspective, and others, regulations, more than demand will put the next squeeze on capacity.
Implied Driver Hires Per Quarter Required By Regulation
The whitepaper just published by JB Hunt concluded by saying “shippers should prepare for significant cost recovery and network rationalization efforts from providers of both highway and intermodal services beginning in late 2014 and into 2015.”
While analysts and other industry leaders have been saying statements like this, it is a big step for one of the largest in the industry to put a whitepaper out on the topic warning customers of the changes ahead.

5. Return on assets is the key ratio trucking companies, which impacts investment in new equipment with the current sentiment being carriers are not yet inclined to expand their fleets.
While there is not one particular chart to point to on this topic, there is plenty of anecdotal evidence that this is the case. The Class 8 truck orders have increased this year, but with the age of the fleets there is not much in terms of growth. To add to that, if there was asset growth, there are not drivers to put in the seats to keep up with regulations.
To sum it up, additional capacity is not being brought on, as carriers are not betting on the come. They were burned in the Great Recession and they will not repeat the pain.
At the same time the industry does not see additional trucks coming online faster than the replacement level, there was a recent stat from the JOC that indicated that all the smaller truckload carriers that go out of business without much fanfare is at such a level equal to the third largest truckload carrier closing down each year. Again, this is another point additional capacity is not coming on quickly.
What all this is telling shippers is the capacity crunch appears to be at our doorsteps and it is time to plan ahead.
There is not a one plan fits all shippers, but there are themes to consider in the plan:
- Become a Carrier Friendly Shipper
- Investigate Additional Carriers to Cover Capacity Shortages
- Implement an Intermodal Strategy for More Capacity Options
- Look to a TMS to Optimize Your Daily Freight Pattern
Source: Integrated Distribution Services
Article Topics
Integrated Distribution Services News & Resources
Creating Mutually Successful 3PL Partnerships through Systems Integration R2 Freight & Logistics Acquires IDS Transportation Services Rail Still Dominates the Logistics Landscape The Ins and Outs of Intermodal Transportation Why Shippers Need Domestic Intermodal in Their Logistics Strategy U.S. Truck Driver Shortage Elevates Importance of Real Estate in Supply Chain Cost Structures Has Truckload Capacity Improved Since “The Perfect Storm” of 2014 More Integrated Distribution ServicesLatest in Transportation
Baltimore Opens 45-Foot Deep Channel Following Bridge Collapse El Paso Border Delays Cost Juarez $32 Million Per Day in Economic Losses Ranking the World’s 10 Biggest Supply Chains The Top 10 Risks Facing Supply Chain Professionals Walmart’s Latest Service: Ultra Late-Night Delivery City of Baltimore Files Lawsuit to Recoup Money for Collapsed Bridge The Era of Self-Driving Tractor-Trailers Set to Begin More Transportation


