Supply Chain & Big Data ÷ Analytics = Innovation
Everyone’s talking about analytics, but supply chain managers want to know if they can drive innovation in their operations, HP’s analytics team explains how.
Google the term “advanced analytics” and you get back nearly 23 million results in less than a second.
Clearly, the use of advanced analytics is one of the hottest topics in the business press these days and is certainly top of mind among supply chain managers.
Yet, not everyone is in agreement as to just what the term means or how to deploy advanced analytics to maximum advantage.
At HP, the Strategic Planning and Modeling team has been utilizing advanced operational analytics for some 30 years to solve business problems requiring innovative approaches.
Over that time, the team has developed significant supply chain innovations such as postponement and award winning approaches to product design and product portfolio management.
Based on conversations we have with colleagues, business partners and customers at HP, three questions come up regularly - all of which this article will seek to address.
- What is the difference between advanced and commodity analytics?
- How do I drive innovation with advanced analytics?
- How do I set up an advanced analytics team and get started using it in my supply chain?
Advanced analytics vs. commodity analytics
So, what exactly is the difference between advanced analytics and commodity analytics? According to Bill Franks, author of “Taming The Big Data Tidal Wave,” the aim of commodity analytics is “to improve over where you’d end up without any model at all, a commodity modeling process stops when something good enough is found.”
Another definition of commodity analytics is “that which can be done with commonly available tools without any specialized knowledge of data analytics.”
The vast majority of what is being done in Excel spreadsheets throughout the analytics realm is commodity analytics.
An example of commodity analytics could be a study on why shipments are late. In this study, the analyst collects the following data into a spreadsheet:
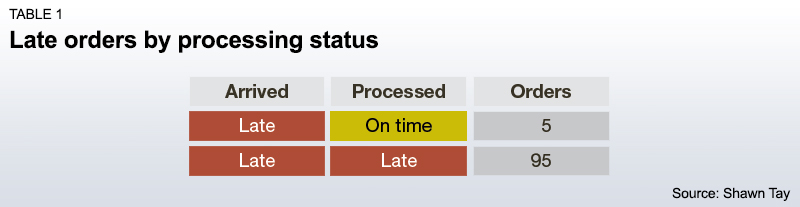
And based on that data, the analyst concludes the following:

The analyst’s recommendation? Fix the orders being processed late in order to stop the late shipments.
However, an analyst (or data scientist) versed in predictive analytics would ask a different question, such as “does late processing predict late orders?” In this case, the analyst would have to gather further details: For instance, how many orders were processed late versus on time, and how many orders arrived on time versus early.
That collected data set would look like the table below.

To present the information in a way that would be easier for human interpretation, the data scientist might put it in the format of Figure 2.
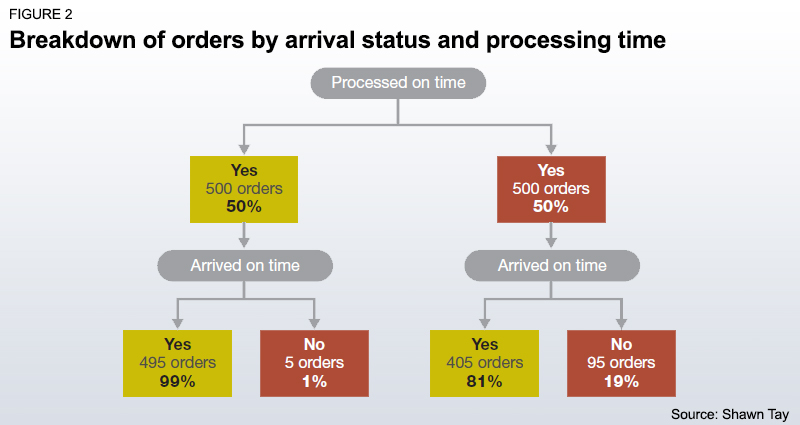
In actuality, whether an order is processed late is not a predictor of whether that order arrives on time. So while fixing order processing time is generally a best practice, it should be recognized that in terms of fixing late orders, 81% of the effort is overkill - or wasted effort.
If we look at it from a decision tree perspective, we would get Figure 3.
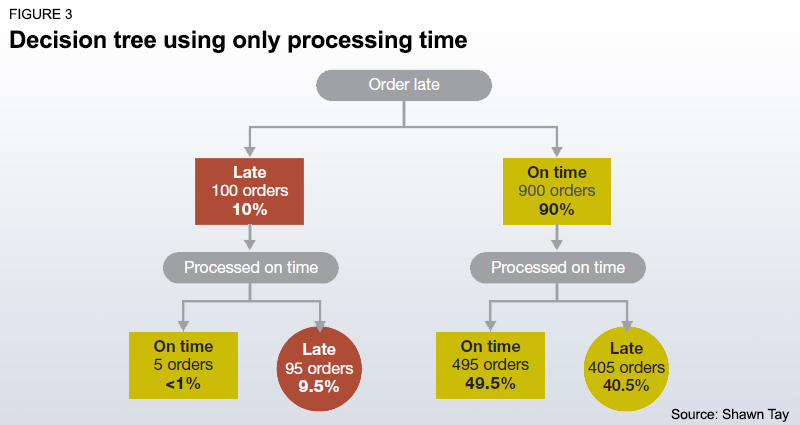
What we want is to develop a model that allows us to predict late orders without catching a lot of on-time orders. However, the test that has been created (orders processed late) not only captures the orders in the box that is circled in red (95 late orders) but also catches the orders in the green circle (405 orders processed late but arriving on time). In other words, this is a test with a high error rate and we need to make further refinements.
At this point, let’s assume that a subject matter expert suggests that having advanced border clearance has a big impact on delivery performance. The data is refreshed with advanced border clearance and the model refined so that the decision tree now looks like Figure 4.
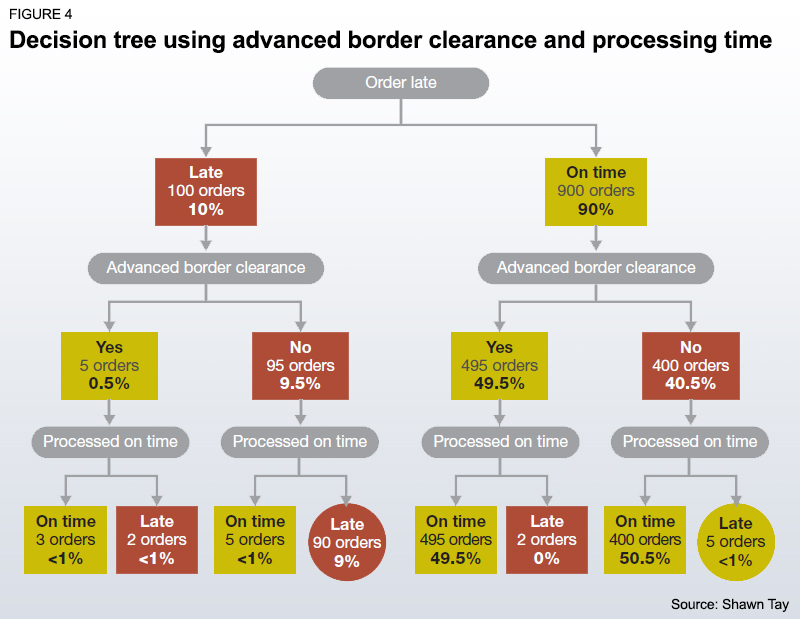
As you can see, the test now captures the majority of late orders, and at the same time excludes the on time orders. We now have a test that can predict 90% of the late orders (90 orders circled in red) while only catching 5 of the on time orders. This is a very significant decrease from the 405 on time orders caught in error in the previous approach.
We also see that there is a cluster of late orders which this model does not identify (circled in green), which suggests that further study with additional data could be done to refine the model to predict those failures. The result would provide the analysis output seen in Figure 5.
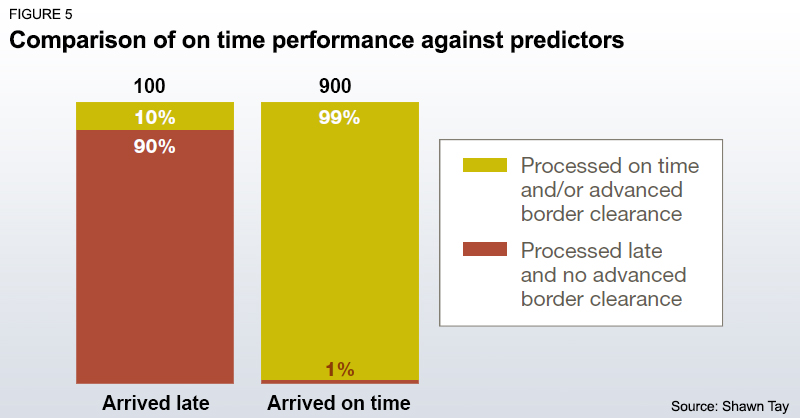
Management now has a robust analysis from which to make a decision. If an order is going to be processed late, it is essential that advanced border clearance be secured for that shipment.
Driving supply chain innovation with advanced analytics
The preceding was a simple example of the difference between predictive analytics and traditional commodity analysis. In reality, the variables that drive a supply chain result would be unknown. The analyst would have taken a data set of shipments that could have dozens of fields (different variables like processing time, weather, clearance status etc.) and thousands of rows (orders) and entered them into machine learning or data mining software. The software would then run a decision tree algorithm to generate the tree.
The depth of the insight drawn from that analysis would be highly dependent upon the skill of the analyst, the quality of the data and how much data is available. In this case, the skill of the analyst is not just technical skill (i.e. how well they know the software and statistics), but also supply chain knowledge. Solid operational knowledge allows an analyst to understand or interpret the results of the analysis and to communicate those findings in a manner that would allow the findings to be actionable.
Supply chain innovation comes from finding drivers of supply chain results that are not widely known in the industry, and then executing process change around those drivers. According to Rich Karlgaard and Michael Malone in Team Genius, the optimal size of an analytics team that can create that level of innovation would be seven to nine high-performing analysts.
We have also found this to be an optimal number at HP as it seems to be the point where there is enough diversity of skills to allow for cross specialization collaboration and idea sharing without running into the issue of too many cooks spoiling the broth. While you might start with a smaller team in order to develop an innovation engine, the team should be incubated to this size to develop an organization’s analytics innovation capability.
Analytics Innovation Case Study: The HP Strategic Planning and Modeling (SPaM) Team
The HP Strategic Planning and Modeling team was identified in the Harvard Business Review article “Building an Innovation Factory” as a best practice in innovation.
Several factors have been identified as key to the success of this team, which specializes in developing analytics solutions to business problems. One important measure of that success is the significant number of patents won for algorithms as well as awards in the field of operations research and analytics.
These success factors should be duplicated to create a successful analytics innovation team.
1. Department should be politically neutral. This can be created by having the team report to the highest possible level within the supply chain organization so the team is not perceived to be part of one faction or another within the supply chain organization. Traditionally the SPaM team reported to the senior vice president of supply chain.
2. Focus on business problems. The team creates analytics solutions for high-importance and high-value business problems. Resources are focused purely on developing innovative solutions to existing problems.
3. Disseminate key learnings through the organization. One of the mandates of the team is to disseminate best practices and lessons learned through the organization. This allows an analytics team to leverage its efforts to drive more business value from solutions developed.
In keeping with Team Genius, the SPaM team is historically 10 to 12 team members, in sub-teams of five to seven that are strategically placed where they can have the most impact for HP.
Advanced analytics: Getting started
Three ingredients are key to getting an advanced analytics initiative underway. These are: having the right people; collecting high quality data and; obtaining the best tools at the right price. This assumes that the organization is already open to the idea of advanced analytics but continues to have a healthy amount of skepticism that can be addressed through insight and the value created by an analytics team. That skepticism can quickly be addressed by having the analytics team drive new insights into the business that translate into cost saving efficiencies or revenue generating opportunities.
1. The right people
Capturing the value of data through advanced analytics is very much about having people with the right mix of business knowledge, technical knowledge, innate curiosity and storytelling skills. Much is made now about the shortage of data scientists, but if you’re just starting off in advanced analytics, hiring Ph.Ds with top tier data science educations may be overkill.
In addition, if you don’t have the systems in place to provide them with the data they need, they may find themselves doing data engineering: finding out where the data is hidden, cleaning that data and setting up basic infrastructure. A freshly minted data scientist looking to make big waves may well find this work unchallenging and it may prove difficult to retain your analytics team.
Instead, try looking first for talent within your organization: Ask if there are any experienced analysts doing top-notch analytics work who can be trained up in advanced analytics skills. Someone like that would be more familiar with the political landscape of your company; they would also know where to find the data gems and which political quagmires they should avoid. Depending on the complexity of your company, a fresh hire could take a year to learn their way around your company.
Training a strong internal candidate may take a lot less time. Colloquial evidence points to it being easier to train analytics skills then to develop a candidate’s business experience and institutional knowledge. This also has the additional benefit of creating a promotion path, which would support retention of your best analytical minds.
2. Good data
It’s very trendy for business executives to jump into Big Data initiatives. However, when you’re first starting off and trying to build small victories in order to scale up the analytics practice, clean data will be more valuable than Big Data. One hundred thousand records with 40 or 50 variables fits just fine into commonly available spreadsheets. For larger datasets or multiple linked datasets, a relational database (like MS Access) can do the job.
While it would great to create a data lake using a tool such as Hadoop, the first step will likely be proving that analytics can create value for the company. Early on, the majority of analytics work is data engineering: The team is finding the data, cleaning it, aligning the different sources and ensuring that the data is usable. As you scale up with success, more sophisticated systems can be brought in as needed.
3. The right tools
Getting the right tools doesn’t have to mean spending a lot of money. There are a number of very powerful, open source analytics tools, like R and Weka. Trial versions of commercial software will allow your team to take a test drive to see if the tools can deliver value for your organization.
When it comes time to scale up, consider Cloud applications that allow you to pay for only the capacity you need. For organizations just starting off, this option could allow for quicker and cheaper execution.
Let a track record of business success drive the decision as to whether to buy a tool or invest in hardware. Most importantly: don’t underestimate the value of open source applications; you may be amazed at what you can get done with a motivated team of analysts and open source software.
Start small, start with what you have
In the examples above, I focused on predictive analytics. However, advanced analytics is a much bigger sphere: graphical analytics, advanced modeling and geo-analytics are just a few examples. While getting started seems intimidating, you can launch a project with a few low cost, easy steps as illustrated above.
Starting small with what you have (and what you can get for free) allows you to build knowledge on what works for your organization. Get the small wins that open the door, then steadily push for resources to score bigger wins.
Advanced analytics are a way to capture business value: they should make, not cost, money.
Using advanced analytics to solve supply chain problems
We list below three very common uses of analytics to solve supply chain problems, not only within HP, but also in supply chains across many companies. While we have used analytics across many supply chain issues, these three can be rapidly executed to show quick wins.
1. Quality control
Traditional methods of quality control involve looking at which metrics on an assembly line would predict the failure of a product. Advanced analytics looks at how combinations of passing measures would result in failure.
For example: A product has two metrics to measure quality. Metric A must be passed within 10% of the target and Metric B must pass within 5% of its target. Advanced analytics can be used to identify that if Metric A is in the 8% to 9% range, the product will fail if Metric B is in the 3% to 4% range.
2. Labor retention
In his book “Predictive analytics: The power to predict who will click, buy, lie, or die,” Eric Siegel highlights the use of advanced analytics by HP to develop flight risk scores that determine the likelihood an employee will leave the company and to then utilize these scores to identify high value - high flight risk employees that the company would have to work to retain.
3. Customer service improvement
With internet connected products, it is possible to tell the usage of a product. Through the use of clustering algorithms, you can group customers with similar characteristics.
You can then look at the usage records of a customer and identify whether there is a problem with their product when compared with their peer group (and fix it before it becomes a business issue) and also analyze their usage of supplies and/or support services to see if their product is running optimally.
About the Author
Shawn Tay is based in Singapore, where he is one of the managers of supply chain and operations analytics for HP. He can be reached at [email protected]
Related Article: Why is Big Data, and Managing it, Such a Big Deal?

Related Analytics White Paper Resources
Real-Time Analytics and How It’s Optimizing Supply Chain Performance
By Youredi · The importance of understanding business intelligence analytics in real-time is constantly increasing as supply chain agility requirements rise, and because of this, thought leaders have begun to adopt supply chain analytics solutions. Download Now!

Optimization Technology as a Catalyst for Supply Chain Innovation
By AIMMS · Advanced analytics have proven to be a valuable resource for progressive supply chain professionals driving transformation in their organizations, despite this, many organizations still struggle to find the right technology to support their efforts. Download Now!
Unlock the Value of Your Supply Chain Through Embedded Analytics
By OpenText · Organizations worldwide are facing unique changes and are subject to unprecedented challenges in their marketplace. Download Now!
Turning “Big Data” Into “Big Visibility”
By One Network Enterprises · Advanced analytics can generate deep and expansive value by providing real time visibility across the supply chain and improving forecasting, demand planning, sourcing, replenishment, production, transportation and logistics, and distribution processes. Download Now!
Effectively Managing Big Data in Your Supply Chain
In this white paper, we’ll explain what the term “big data” means to the typical supply chain, introduce effective strategies for managing and leveraging that data, and explain the “first steps” that companies need to take down the path to effective management of their big data. Download Now!
More Related Analytics “Big Data” White Papers
Article Topics
AIMMS News & Resources
The Post-Pandemic Warehouse & Distribution Center Workplace Assessing Supply Chain Planning: Ready for Today’s Challenges? Supply Chain Professionals Say Planning Process is “Somewhat Effective” Regardless of Technology Spending Too Much Time on Data Crunching and Not Enough on Resilient Planning Decisions Supply Chain Planning, Optimized | 3 AIMMS Case Studies Organizations are Betting on New Technologies to Improve Demand Forecasting Accuracy How is Demand Forecasting Changing? More AIMMSLatest in Technology
Biden Gives Samsung $6.4 Billion For Texas Semiconductor Plants Apple Overtaken as World’s Largest Phone Seller Walmart Unleashes Autonomous Lift Trucks at Four High-Tech DCs Talking Supply Chain: Procurement and the AI revolution 80% of Companies Still Unsure How to Best Leverage AI, Study Finds Supply Chain Stability Index: “Tremendous Improvement” in 2023 AI Not a Priority for Retailers and CPG Companies More Technology


