December 2013 ISM Manufacturing Survey Above Expectations
Economic activity in the manufacturing sector expanded in December for the seventh consecutive month, and the overall economy grew for the 55th consecutive month, say the nation’s supply executives in the latest Manufacturing ISM Report On Business.
The ISM Manufacturing survey for December 2013 showed the expansion was marginally weaker.
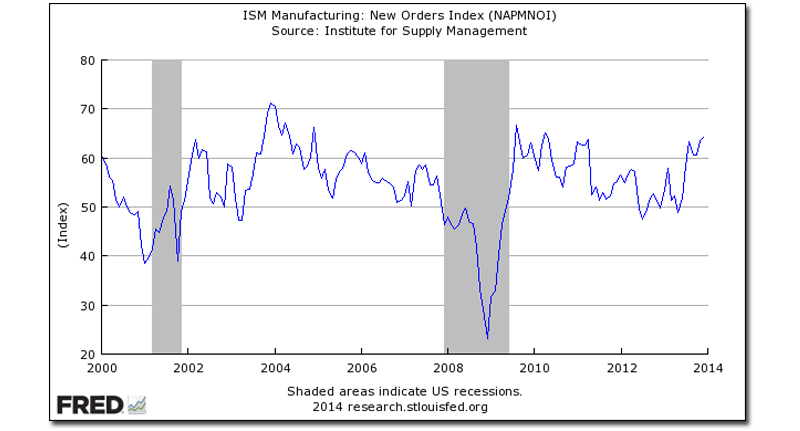
The New Orders sub-index which historically correlates to the economy improved.
The ISM Manufacturing survey index (PMI) declined marginally from 57.3 to 57.0 (50 separates manufacturing contraction and expansion).
This was above expectations which were 56.7 to 56.9.
This index had been in a general downtrend since mid 2011. This is the sixth month of expansion after four months of decline.
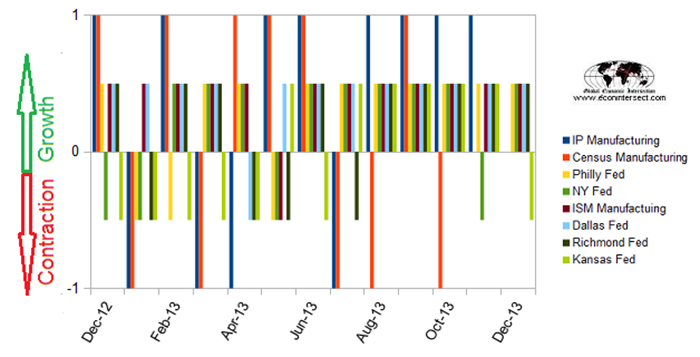
All but one Fed survey and now the ISM shows manufacturing improved in December (an unusual event which is becoming usual).
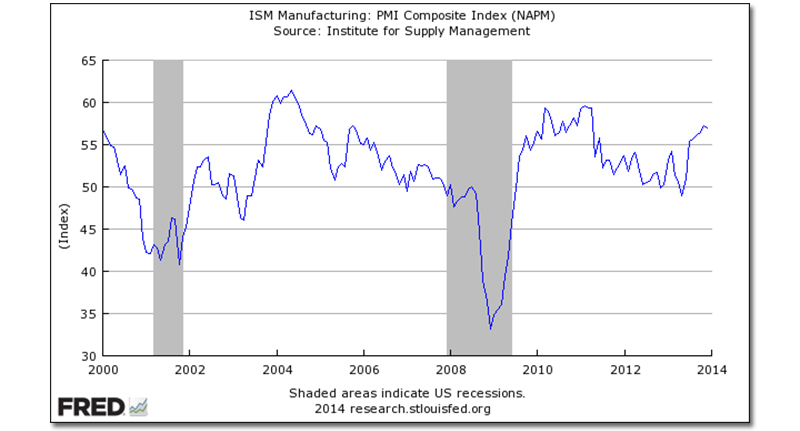
Relatively deep penetration of this index below 50 has normally resulted in a recession.
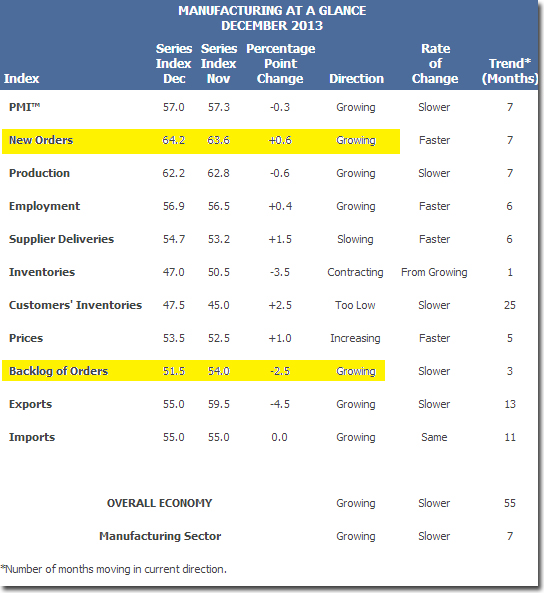
The noisy Backlog of Orders declined from 54.0 to 51.5. Backlog growth is an indicator of improving conditions; a number below 50 indicates contraction. Backlog accuracy does not have a high correlation against actual data.
Economic activity in the manufacturing sector expanded in December for the seventh consecutive month, and the overall economy grew for the 55th consecutive month, say the nation’s supply executives in the latest Manufacturing ISM Report On Business®.
The PMI™ registered 57 percent, the second highest reading for the year, just 0.3 percentage point below November’s reading of 57.3 percent. The New Orders Index increased in December by 0.6 percentage point to 64.2 percent, which is its highest reading since April 2010 when it registered 65.1 percent. The Employment Index registered 56.9 percent, an increase of 0.4 percentage point compared to November’s reading of 56.5 percent. December’s employment reading is the highest since June 2011 when the Employment Index registered 59 percent. Comments from the panel generally reflect a solid final month of the year, capping off the second half of 2013, which was characterized by continuous growth and momentum in manufacturing.
Of the 18 manufacturing industries, 13 are reporting growth in December in the following order: Furniture & Related Products; Plastics & Rubber Products; Textile Mills; Apparel, Leather & Allied Products; Computer & Electronic Products; Paper Products; Transportation Equipment; Primary Metals; Fabricated Metal Products; Wood Products; Printing & Related Support Activities; Food, Beverage & Tobacco Products; and Miscellaneous Manufacturing. The four industries reporting contraction in December are: Nonmetallic Mineral Products; Machinery; Chemical Products; and Electrical Equipment, Appliances & Components.
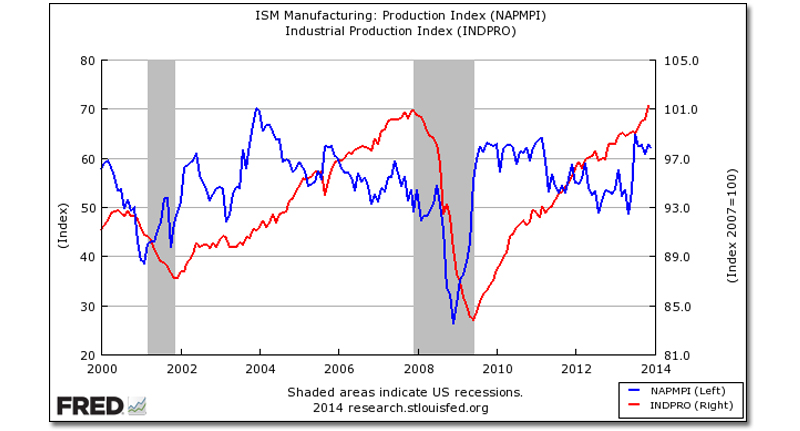
It is interesting to note that ISM Manufacturing represents less than 10% of USA employment, and approximately 20% of the business economy. Historically, it could be argued that the production portion of ISM Manufacturing leads the Fed’s Industrial Production index – however the correlation is not strong when looking at trends.
New orders have direct economic consequences. Expanding new orders is a relatively reliable sign a recession is NOT imminent. However, New Orders contraction have given false recession warnings twice since 2000.
However, holding this and other survey’s Econintersect follows accountable for their predictions, the following graph compares the hard data from Industrial Products manufacturing subindex (blue bar) and US Census manufacturing shipments (red bar) to the ISM Manufacturing Survey (purple bar).
Caveats on the use of ISM Manufacturing Index:
This is a survey, a quantification of opinion – not facts and data. However, as pointed out above, certain elements of this survey have good to excellent correlation to the economy. Surveys lead hard data by weeks to months, and can provide early insight into changing conditions.
Many use ISM manufacturing for guidance in estimating manufacturing employment growth. Econintersect has run correlation coefficients for the ISM manufacturing employment and the BLS manufacturing employment data series above going back to 1988, using quarterly data. The coincident correlations are actually negative, but poor (r = -0.2 to -0.4 for various time periods examined). See here for definitions.
Before 2000 the ISM employment data had a weak positive correlation to the BLS data 4 to 7 quarters later (r values above 0.6). Since 2000 the correlations for ISM manufacturing employment as a leading indicator for the BLS manufacturing employment have been between 0 and 0.3 for r (correlation coefficient). These values define correlations as none to poor.
In other words, ISM employment index is not useful in understanding manufacturing jobs growth. The graph below shows BLS manufacturing employment month-over-month gains against the ISM Manufacturing employment index.
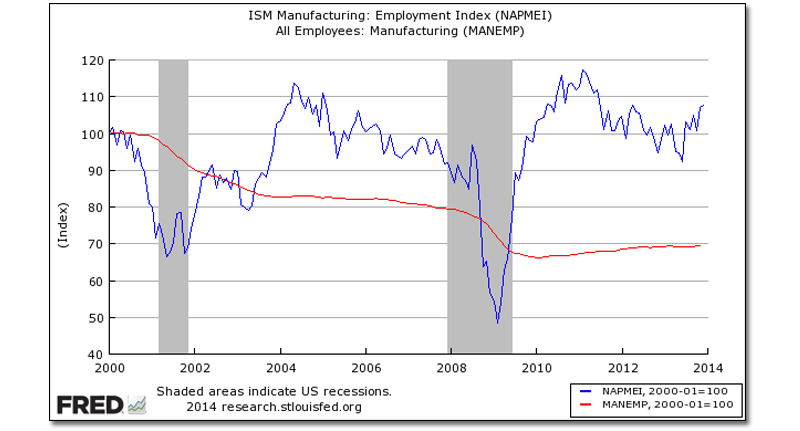
The ISM employment index appears useful in predicting turning points which can lead the BLS data up to one year.
Source: Global Economic Intersection
About the Author
Steven Hansen, Publisher and Co-founder of Econintersect, is an international business and industrial consultant specializing in turning around troubled business units; consults to governments to optimize process flows; and provides economic indicator analysis based on unadjusted data and process limitations. Graduated 1971 California State Polytechnic University at San Luis Obispo.
Article Topics
Institute for Supply Management News & Resources
U.S. Manufacturing Gains Momentum After Another Strong Month Services sector sees continued growth in March, notes ISM Manufacturing sees growth in March, snaps 16-month stretch of contraction Services sector activity sees continued growth in February, ISM reports Services sector activity sees continued growth in February, reports ISM February manufacturing output declines, reports ISM February manufacturing output declines amid strong seasonal factors More Institute for Supply ManagementLatest in Business
Ranking the Top 20 Women in Supply Chain TIm Cook Says Apple Plans to Increase Investments in Vietnam Amazon Logistics’ Growth Shakes Up Shipping Industry in 2023 Spotlight Startup: Cart.com is Reimagining Logistics Walmart and Swisslog Expand Partnership with New Texas Facility Nissan Channels Tesla With Its Latest Manufacturing Process U.S. Manufacturing Gains Momentum After Another Strong Month More Business