COVID-19 Global Trade Fallout: The container boom has lasting power
Over the course of 2021, ocean carriers will continue to operate at high capacity utilization levels, and ocean rates will remain high. Moreover, along with the need for elevated container circulation, high demand will continue to favor the Pacific Coast ports for Asian imports destined for the Midwest.
At the end of 2019, I was anticipating that the introduction of the IMO 2020 sulfur regulations was going to further disrupt the system of international trade that was already turned on its head by the U.S./China trade war. Then COVID forced a reset of all expectations.
To understand the big shifts happening with North American container trade today and form an educated outlook for the remainder of the year, we must revisit how the trade war affected global container flows.
Prior to 2019, the U.S. container market was stable in many important ways. There were strong correlations between real GDP and import demand, and between import demand and seaport throughput.
The relative balance of imports from Asia, other North American countries (Canada and Mexico), and Europe had been very stable since 2011. Moreover, there was a slow, predictable shift in coastal shares of container imports, with the Pacific Coast ports losing share to ports on the Atlantic and Gulf coasts.
This shift was largely due to liner operators incentivizing customers to route Asian goods destined for the Midwest over longer routes, as doing so both helped limit an oversupply of slot capacity and allowed carriers to keep a larger share of revenues rather than split them with the BNSF or UP railroads.
In January 2019, the imposition of new tariffs had an immediate and significant impact on sourcing patterns. China’s share of imports fell dramatically, and other Asian countries were able to absorb only around two-thirds of China’s share loss. The remainder shifted to other trade lanes, affecting which coasts and ports would handle the volumes. This, in turn, had a major influence on inland intermodal and inter-regional trucking.
Excess capacity in the global production system allowed the rapid response to tariffs, but by the end of 2019, it appeared that nearly all the importers that could easily shift sourcing patterns had already done so. Consequently, the coastal geographic redistribution of imports was set to slow significantly in 2020. Importantly, China was left with excess capacity while many other countries were bumping into limits.
COVID impacts
The effects of the pandemic first began to be felt in China, where workers were quarantined and did not return to factories after the Chinese New Year. But it wasn’t long before the virus jumped the border.
In the first quarter of 2020, container imports were down 6% from the first quarter of 2019, and the second quarter proved much worse, with container imports falling more than 10% on a year-over-year basis. In total, container imports fell shy of the 10.5 million TEUs imported in the first half of 2019 by nearly 1 million TEUs.
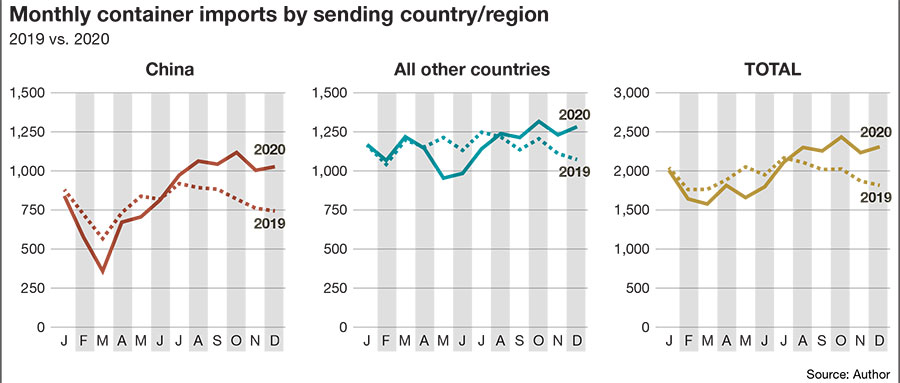
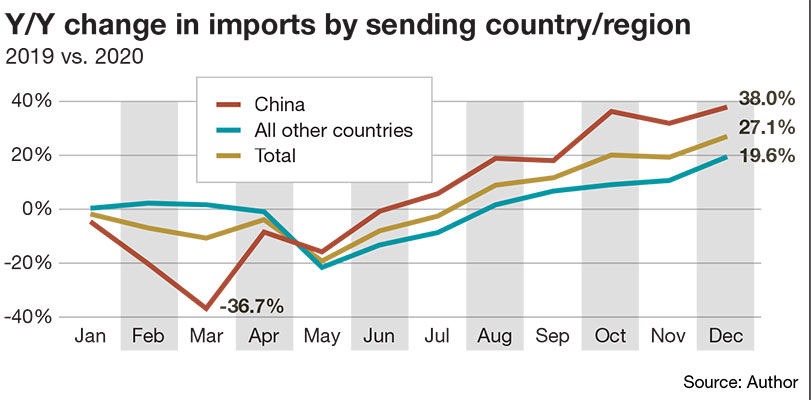
Geographically, these declines were not experienced evenly.
As can be seen in the graphic, imports from China were down on a year-over-year basis every month over the first half, while imports from all other countries remained strong until May. Over the second half of the year, however, imports from China alone were more than 1.2 million TEUs higher than they were in 2019. Following the trade war, China was left with idle capacity, and production could easily ramp up.
The predominant theory is that the strength of imports over the second half of 2020 was driven by restocking, but national statistics suggest otherwise. Retail sales reached all-time highs in June and remained well above 2019 levels through the end of the year. Meanwhile, inventories remained at 2016 levels and inventories/sales ratios dropped to historical lows. The need to replenish inventories remains.
Because China had a lot of spare capacity (due to the trade war impacts), China was able to gain back much of its lost share over the second half of 2020, and it did so with monthly volumes growing by an average of 14% and 35% in the third and fourth quarters.
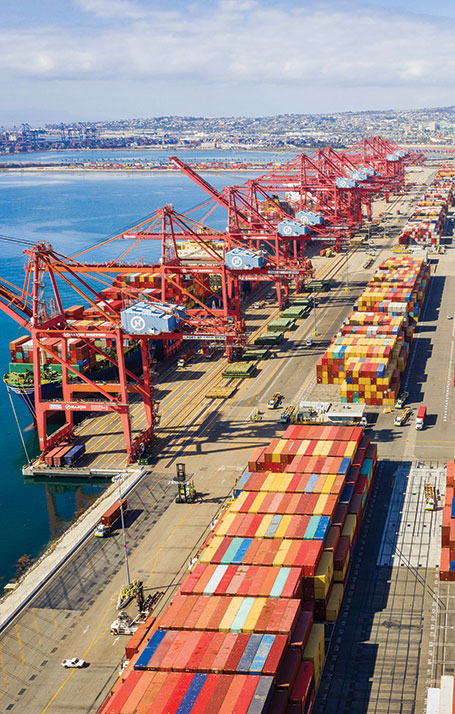
The shift back to China has allowed the Pacific Coast to regain some lost share, and the San Pedro Bay ports have outperformed the Pacific Coast, with import volumes up 5.9% in total. This growth has been driven by Chinese imports that are up 12% over the year.
Will the Pacific Coast continue to regain share in a tight container market? Will the container market continue to be tight, and freight rates to remain so high? I think the answers are yes and yes.
Impact on U.S. GDP and a broken model
The global pandemic has had a significant impact on North American real GDP, which contracted by around 3.6% in 2020 (based on advanced estimates from the United States and Canada).
I maintain a North American container throughput model that has proven to be very accurate over the last decade—even through the global financial crisis in 2008-2009—but this model predicts that container imports would have contracted 5.3% because of the economic contraction, when volumes actually rose by 2.9%.
How was this possible, and why did it happen?
First, let me say that there is every reason to believe that the relationship between imports and real GDP will eventually return to the extremely well-established trend, but a new model is needed to explain and predict container volumes in the interim.
My firm has shifted to a model based on retail sales excluding food services (retail sales EFS). Over the 2011 to 2018 period, observed variations in retail sales excluding food services have been able to explain/predict 99.7% of the observed variation in container imports.
Unlike real GDP, retail sales EFS have grown on a year-over-year basis, and they set consecutive all-time highs in June, July, August, and September. In December they were still 5% higher ($24.6 billion) than what they would have been had the very stable pre-pandemic trend continued through the year. So, we have a model that should work, and the question is when will we need to switch back? This year? Next? Later?
A new, albeit temporary, normal
The highly unusual and unexpected surge in retail sales excluding food services was made possible by several factors. First, and most obvious, retail food service sales have fallen off a cliff, and they remain nearly 20% below the long-established pre-pandemic trend. This amounts to “savings” of slightly more than $12.2 billion per month.
If all that money was spent on retail goods, we must still explain around half of the $24 billion excess in goods purchases. And, while food services require lots of domestic truck shipments, unlike retail goods, food services generate extremely limited container import demand.
There has been an even more impressive decline in consumer spending on airfare and accommodations, which contracted by around $370 billion, or around $30 billion per month, in 2020, and they have only partially recovered. Consequently, decreased spending on food services, airfare and accommodations alone exceeds the unusual increase in retail sales of goods.
However, there is still more to this story that must be understood in order to project future container volumes. Disposable personal income (calculated as wages + non-wage income–income taxes) jumped from $14.95 trillion in March to $17.29 trillion in April (+$2.125 trillion) as the first wave of stimulus was distributed. For perspective, an increase of this magnitude typically requires more than five years to achieve under normal conditions. Disposable income remains 3.4% higher than pre-pandemic levels.
This historical increase resulted in several “downstream” effects. First, consumers wisely paid off a significant amount of debt, and (also wisely), the aggregate personal savings rate jumped from a long-term average of around 7.4% to 33.7% in May. Aggregate personal savings remain 70% higher than they were in February, hence there’s a significant amount of spending power sitting idle.
If all this sounds unusual and impressive, it is. However, what’s even more interesting is that while employment levels have fallen by around 10 million, and total non-farm employment is roughly equal to what it was back in 2015, total non-farm weekly wages have largely recovered, and they are now equal to what they were at the end of 2019. This has happened because the jobs lost were largely the lowest paying jobs available.
A grand reversal
 As container volumes jumped to extremely high levels over the second half, the plague of cancelled sailings that rocked carriers over the first half of 2020 nearly completely disappeared over the second half as the ocean carrier market struggled to keep up with demand—and in many cases fell behind as equipment imbalances left factories without containers to stuff.
This has had an important impact on North American port competitiveness. A weekly ocean service from China to the Pacific Coast requires around six vessels to support a 42-day rotation. By contrast, a weekly service from China to the Atlantic Coast requires around 11 vessels to support the 77-day rotation.
Consequently, the easiest way to increase capacity is to add capacity to the trans-Pacific, which has the added benefit of decreasing the circulation time for the containers, thereby helping to relieve the equipment crunch.
What does 2021 have in store?
There is every reason to think that food services and travel and tourism expenditures will remain suppressed at least through 2021. Although total employment remains low, wages have largely recovered, and another round of stimulus is in the works—and may have been distributed by the time you read this.
Consequently, retail goods purchases can easily continue chugging along at a level 5% to 8% above the pre-pandemic trend, and there is every reason to expect that they will. Moreover, inventories remain suppressed, so container demand will be further bolstered by restocking demand.
This all supports the position that ocean carriers will continue to operate at high capacity utilization levels, and ocean rates will remain high. Moreover, along with the need for elevated container circulation, high demand will continue to favor the Pacific Coast ports for Asian imports destined for the Midwest.