2014-2017 Analysis of Tesla Injury Rates
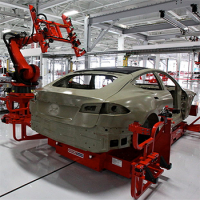
Over the past several months, workers at Tesla became increasingly aware of the potential safety hazards at the company’s flagship vehicle plant in Fremont, California, and in April, workers first requested copies of the OSHA Form 300, the log of work-related injuries and illnesses that companies are required by law to make available to their employees.
Over the past several months, workers at Tesla have become increasingly aware of the potential safety hazards at the company’s flagship vehicle plant in Fremont, California.
In April 2017, workers first requested copies of the OSHA Form 300, the log of work-related injuries and illnesses that companies are required by law to make available to their employees.
Worksafe, a California non-profit organization that specializes in workplace health and safety issues, analyzed this data in order to interpret the data and evaluate how their plant compared to other auto manufacturing facilities.
This report represents the findings of that analysis.
Key Findings
- Tesla’s total recordable incidence rate (TRIR) in 2015 was 31 percent higher than the industry-wide incident rate (8.8 injuries per 100 workers, compared to 6.7 for the automobile manufacturing industry as a whole). The TRIR represents the average number of nonfatal injuries per 100 full-time workers. This means that workers at the company’s Fremont plant were injured more than the average automobile industry workers.
- Tesla’s total injury rate for 2016 was 8.1 injuries per 100 workers. While official industry-wide statistics are not yet available for 2016, based on the previous three years of industry data it is very reasonable to expect that the company’s rates will again surpass the industry-wide incident rate (“industry rate”), which has stayed relatively constant over time.
- The rate of serious injuries at Tesla’s Fremont plant - those that result in days away from work, restricted duty, or job transfer - was approximately double the industry rate for 2015. This measurement is known as the DART rate (“Days Away, Restrictions and Transfers”). The DART rate at Tesla in 2015 was 7.9 compared to the industry average of 3.9. Tesla’s DART rate for 2016 was 7.3, which based on the previous eight years of industry data, it is reasonable to expect will again be higher than the industry rate.
In addition, the report analyzes Tesla’s recent public statements that its injury rates have declined, which are based on a comparison of total injury rates between the first quarter of 2016 and the first quarter of 2017.
Our conclusion, for reasons detailed below, is that the injury data Tesla has recorded so far for Q1 of 2017 is too preliminary to be considered accurate given Tesla’s erratic reporting patterns. And perhaps most importantly, one quarter is not a sufficient length of time to accurately identify a meaningful and lasting trend in injury reduction.

What’s Related
Favorites


