What’s Wrong with Demand Forecasting?
There are two equally important outputs of demand forecasting and you may be focusing nearly all your energy on only one, and maybe even the wrong one.
Maybe you are doing your demand forecasting completely wrong.
To be more precise, there are two equally important outputs of demand forecasting and you may be focusing nearly all your energy on only one, and maybe even the wrong one.
And the impact is that you may not be getting the forecast accuracy you want.
Or even more important, that you may not be getting the service levels and inventory efficiencies that you need.
And if that’s true, you are not alone.
The number of companies is growing that are saying that their forecast accuracy, service levels and inventory efficiency metrics have hit a ceiling that they just can’t get past.
Whether you read the analyst reports or listen to planners talk about their jobs, it’s all the same: metrics and KPIs are stuck.
Here is the dilemma to consider. Demand forecasts should predict two outcomes: the expected demand and how much uncertainty there is in that prediction.
The need to predict demand is fairly obvious. It drives most supply chain planning activities. And you probably measure the efficacy of your tools and processes with well-known forecast accuracy KPIs.
But the need to predict forecast uncertainty is not nearly as clear, and you probably make some gross assumptions about demand uncertainty and just assume they are accurate. By the way, if you don’t know whether or not you are making these assumptions, then we can pretty much guarantee that you are.
So it comes down to this. If you have a lot of fast moving stock and unaggressive service level targets, then focusing mostly on expected demand and forecast accuracy is probably a reasonable approach. What we mean by “unaggressive” varies by industry, but for for example, for a fast moving consumer good company we’d say below a 96% line-fill rate.
But if instead you are facing more long tail demand or aggressive service levels, then predicting uncertainty becomes much more important. Here’s why.
A Different Type of Prediction
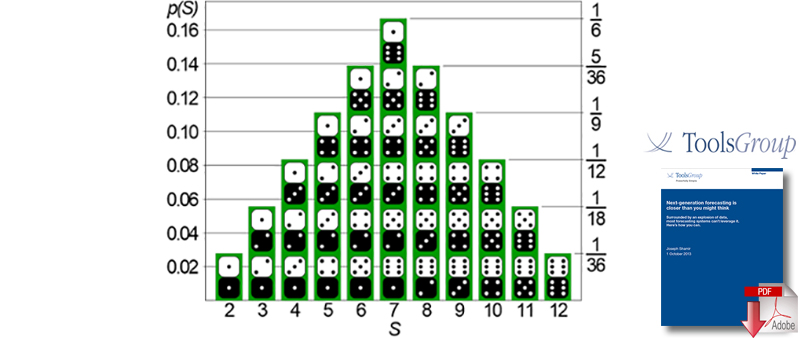
It starts with what constitutes forecast error. All the common definitions of forecast error share a fundamental flaw - they assume a perfect forecast and define all demand variability as forecast error. But in reality, variability is perfectly normal. Surprisingly, while you can’t predict demand perfectly due to its inherent variability, you can predict demand variability. For example, you cannot predict the outcome of the role of two fair dice. There is just too much variability. But you can accurately predict the range of possible outcomes and the probability of each outcome. That is, you can predict its variability.
And when you predict the variability, not only is this a more realistic task, it also leads to better business decisions. Consider a weather forecast. If you make an exact “rain” or “no rain” prediction, that information is helpful, but not nearly as helpful as providing a probability of rain. If you are planning an outside activity knowing there is a 5% chance of rain, you will likely make one plan. If there is a 40% chance of rain, you may make a different plan or have a backup plan for inside. That 40% figure provides you with more information to make better plans than an absolute rain/no rain prediction.
It doesn’t take much to see that such a probabilistic forecast and improved prediction of uncertainty is useful information in supply chain planning. And in fact, accurately predicting uncertainty can add enormous value. That’s because you are focusing on improving not just to the average demand prediction but the entire range of possible demand predictions - including the extreme variability that has the biggest impact on service levels. Because when supply plans or safety stocks are based on wrong assumptions about demand uncertainty, targets go unmet and supply chains go into firefighting mode.
And predicting uncertainty better leads directly to smarter safety stocks - able to capture a larger range of possible demand outcomes, catch more demand spikes, and buffer the rest of the supply chain. With a focus on the range of possible demand values, the number and the severity of supply chain disruptions decreases, leading to a more stable supply chain. Knowing the probabilities of demand coming in higher or lower than the expected value allows you to mitigate risks and capitalize on opportunities.
Another Way to Look at Forecast Error
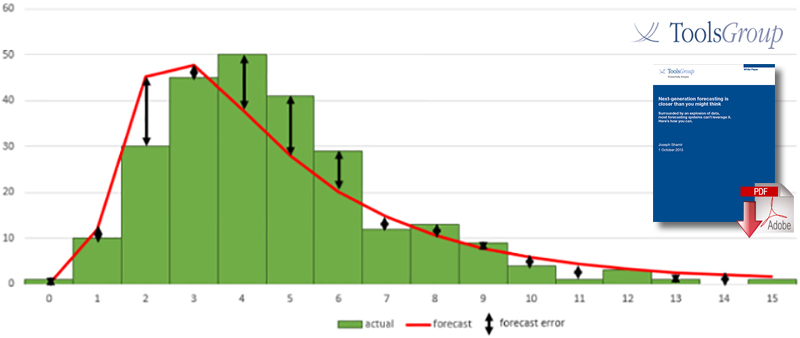
To improve demand uncertainty predictions, it helps to have a forecast accuracy measurement or a KPI similar to Mean Absolute Percent Error (MAPE). This means forecasting the range of possible demand values and then determining how much error there is between the predicted and actual demand distribution. And when this predicted demand distribution does not accurately represent the actual demand distribution, that difference (highlighted in the figure above) is the forecast error. That is, we are measuring the accuracy across the range of outcomes, not just against a single average value.
Nassim Nicholas Taleb described this type of forecast accuracy measurement in his book, The Black Swan. He explains that measuring the accuracy of a stochastic forecast based on probability distributions is inherently different than measuring the accuracy of a traditional forecast, whose results are expressed by single-point expected values. He states that if you predict with a 20% probability that something will happen and across many instances it actually happens 20% of the time, that the error is 0%. Naturally, it would also need to be correct for every other percentile (not just the 20 percentile) to be 100% accurate.
Two metrics are now available to measure the accuracy and value of stochastic forecasts in this way. Total Percentile Error (TPE) measures the accuracy of the full spectrum of uncertainty in a stochastic forecast. It measures the reduction in error - rather than the increase in accuracy - since there is a stronger correlation between error and business impact than between accuracy and business effect. Stochastic Value Add (SVA) measures the value derived from this additional information.
For most supply chain practitioners, the precise calculation methodology for these KPIs is not required to use them, just like MAPE is useful even when you don’t know exactly how it’s calculated.
However, a more in depth discussion on these metrics is available in a series of blogs starting at “The Greatest Missed Opportunity in Demand Forecasting.”
Meanwhile, we recommend taking a serious look at a demand forecasting system that accurately predicts demand uncertainty so you can break through your KPI barriers.
Article Topics
ToolsGroup News & Resources
Digital Transformation in Supply Chain Planning: 2021 Study shows 74% of digital supply chain planning transformations influenced by Covid Machine Learning Steps Up Retail Performance Machine Learning, Little Black Dress or Accessory? Mastering the Long Tail & Intermittent Demand Intermittent Demand is Not Unforecastable Demand National Health Service Blood Supply Chain Study More ToolsGroupLatest in Supply Chain
Microsoft Unveils New AI Innovations For Warehouses Let’s Spend Five Minutes Talking About ... Malaysia Baltimore Bridge Collapse: Impact on Freight Navigating TIm Cook Says Apple Plans to Increase Investments in Vietnam Amazon Logistics’ Growth Shakes Up Shipping Industry in 2023 Spotlight Startup: Cart.com is Reimagining Logistics Walmart and Swisslog Expand Partnership with New Texas Facility More Supply Chain


