Turn Supply Chain Data into Actionable Information
Okay, so you’re committed to rolling out Business Intelligence across your supply chain, you have tons of data, so how do you turn that data in to actionable information?
There is a continuum in terms of presentation of data that allows for continuous sophistication in understanding and interpreting data.
There are lots of ways to view data, but three that are particularly useful in supply-chain analytics are—Reporting, Scorecarding, and Benchmarking.
The simplest form of looking at data is what we have all seen dozens of times, we call it “Reporting”. Back in the day, reporting was numbers printed out on green bar paper, but today’s business intelligence reports are far more detailed and dynamic than in the past.
For instance, a business intelligence (BI) report of today displays all the data about transportation providers as usable information, in a scorecard format. Factors such as on-time delivery, freight cost per unit shipped, and transit time are assigned metrics and weighted averages to help users determine how well carriers are performing overall.
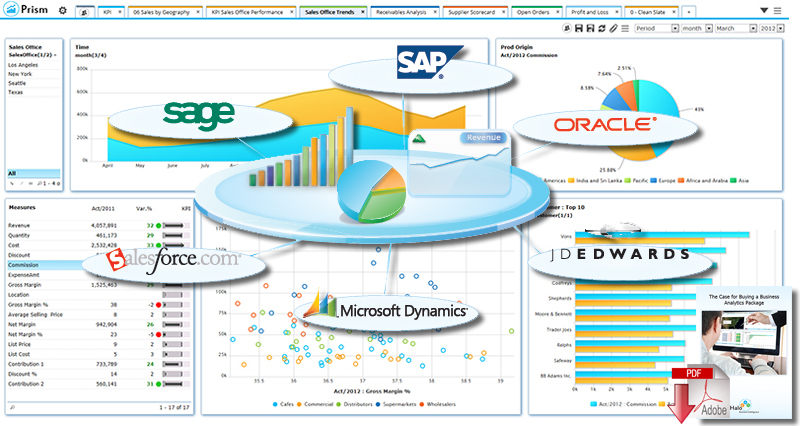
Operation managers and executives who want a quick, daily overview of what is happening in their transportation or supply chain network use dashboards to provide information in near real-time to help users understand what is happening within their network, and allows them to make proactive decisions to remedy problems as they occur. Where reporting is really like looking in the rearview mirror, dashboards are used to see what’s going on now, and makes it easier for users to identify trends and exceptions, and to intervene before something goes wrong.
Dashboards can be implemented by companies to track all their real time data and provide detailed reports of information such as claims as a percent of freight cost, space utilization, fuel efficiency, vehicle time utilization. Essentially, the dashboard determines whether or not a transportation system is effective. Significant cost savings can occur when KPI’s are monitored and the data is accessible in a format that allows users to make informed decisions. The biggest advantage of using dashboards to present Business Intelligence data is that dashboards give companies the advantage of allowing, users to make decisions without having to wait for someone to pull and send reports.
Business Intelligence applied to supply chain also allows for benchmarking. Comparing data on factors such as freight rates and on-time delivery percentages against peers allows companies to get a more complete picture of their performance in the marketplace. Take freight rates, for example. Rates have fluctuate with the economy recently, so your job is really to assess whether or not a deal offered by a vendor is good or not. By benchmarking carriers against each other, you can easily see who is offering you the best deal.
Consistently monitoring and making informed decisions based on data is good business intelligence. As you become more mature in your supply chain analytics, you will be able to apply predictive and prescriptive analytics to find patterns in historical data that yield insights into future risks and opportunities in your supply chain and transportation networks. This predictive analysis capability uses real-time data-driven insights to speed decision-making and help create an optimized and responsive supply chain.
So as you think about rolling out a BI system. Think in terms of the applications, not the data. Think about what reports are important and how scorecards could improve your visibility into data. Develop dashboards to give you a look ahead, and use scorecards to make sure that you are getting the best deal from your vendors and suppliers.
Doing this allows you to see what you want, and get what you see.

About the Author
Ray Major is the Chief Strategist of Halo Business Intelligence. A data scientist, economist and statistician by training, he’s a life-long practitioner in the mysterious arts of data intelligence and analytics.
You can contact Ray by email at [email protected] and also follow him on Twitter at @majorbi
Related: What Makes an Effective Analytics Group Part of Your Supply Chain Organization?


