How Supply Chain Inventory Optimization Opens Pathways to Profitability
Inventory optimization has never been easy, but advanced tools now available are enabling companies to do the job faster, more accurately, and with greater business impact.
Over the past decade, inventory optimization has moved from a theoretical construct relegated to classroom instruction to a practical tool that improves corporate profitability. The underlying drivers of inventory, in the form of demand and supply variability, are common to all supply chains, making inventory optimization (IO) applicable to every industry.
Underscoring the broad applicability of IO, many diverse businesses have realized dramatic improvements in supply chain performance including:
-
Case New Holland executed a postponement strategy that reduced total inventory by 20 percent for its line of compact tractors.(1)
Hewlett Packard achieved more than $130 million in total inventory savings.(2)
Microsoft increased inventory turns 18-20 percent while simultaneously increasing fill rates by 6-7 percent.(3)
Procter & Gamble reduced inventory levels by $100 million for its beauty division.(4)
These results are not isolated incidents. For companies that implement IO, a 10 to 30 percent reduction in total inventory is common. This article documents the transition to IO, what companies have gained from implementing inventory optimization, and how these tools can be integrated into any company. I will also review real world examples of IO in action, keys to success, and questions you need to ask yourself before moving ahead with an IO initiative.
How Did We Get Here?
Four factors have contributed to the growth of inventory optimization in the past decade: the success of operations-focused improvement initiatives; the brute-force reconciliation of supply and demand; the focus on metrics for supply chain performance; and the existence of commercial IO software.
First, IO is built on the foundation established by successful business process reengineering, lean manufacturing, and six sigma projects. While these initiatives are different, and each worthy of their own article, they are relevant to IO because they establish a rigorous relationship between supply chain inputs and outputs. Further, they provide an excellent foundation that can accelerate the realized benefits from inventory optimization.
Second, companies have worked hard to remove gross imbalances between supply and demand. By making capacity levels and material purchase plans more tightly match projected demand, there is greater emphasis on properly setting inventory targets. Following the global financial crisis and the subsequent slashing of inventory across the board, there is no longer an excess of production capacity or stockpile of leftover inventory builds to satisfy fluctuations in demand. Now, one has to meet these fluctuations with scientifically derived inventory targets, which requires proven IO software to optimize the end-to-end supply chain.
Third, there has been significant adoption of metrics, like service level and cash-to-cash cycle time, that require a supply chain orientation and can only be improved with tools like IO.
Fourth, proven software capable of solving complex IO problems across global supply chain networks is now commercially available. As opposed to deterministic optimization methods that underlie advanced planning and scheduling (APS) systems, the underlying mathematics for inventory problems required the development of stochastic nonlinear integer solution methods. While this IO math is different than APS math, it is not industry specific; thus, the same software can be deployed across different industries to optimally set and manage inventory positions.
What is Inventory Optimization?
Inventory optimization was born as an advanced algorithmic approach to understanding and quantifying the propagation of demand and supply uncertainties across a multi-level supply chain. Today it is considered a core competency at both mid-size and Fortune 500 companies in a wide range of industries. IO has proven to be a sustainable process to free up millions of dollars in working capital by reducing inventory without damaging service levels. Unlike traditional “binge-and-purge” cycles of overproduction followed by brute-force reductions, IO enables companies to achieve savings and increase inventory turns while driving more profit to the bottom line.
In short, inventory optimization scientifically determines the minimum inventory targets across the entire supply chain network subject to constraints established by the planner.
Different Ways Companies Set Inventory Targets Today
Companies today set inventory targets in various ways. The methods used can be viewed along the following continuum from completely ad hoc and heuristic to globally optimal: (1) no formal targets; (2) employ rules of thumb; (3) use single-stage calculations; and (4) use multi-echelon software tools.
At the simplest level, some companies still do not set formal inventory targets. Instead, they manage inventory by padding the schedule and making items earlier than required. For all but the simplest of products, this safety-time approach is woefully inadequate. A more prevalent approach is to employ a rule-of-thumb target. This involves setting a days of supply (DOS) coverage target for every item. While DOS rules of thumb are easy to understand, they have two serious limitations. First, DOS is based on average demand and not variability. Second, DOS approaches are forward looking whereas inventory targets are actually backward looking because they are an outcome of production decisions made in earlier periods.
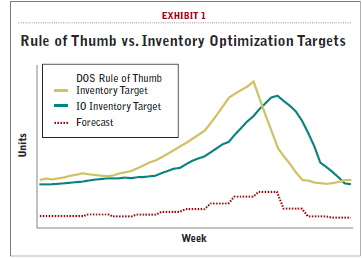 Exhibit 1 presents a real-world illustration of the problem of forward-looking targets at Microsoft. In this case, a forward DOS target reduces inventory too soon because in the peak period of demand the DOS target is already looking forward to the off-peak period. As such, the DOS target lowers inventory levels before the peak sales period, which results in lost sales. The DOS target also builds inventory up while demand is still in the low period. So not only do service levels suffer but overall inventory levels for the year are higher than they should be when compared to the results from IO. (More details on this particular issue and the associated Microsoft example can be found in Neale and Willems, 2008.)
Single stage calculations are an improvement over rules of thumb—but they still have significant limitations. First, it is more appropriate to think of these models as calculating vs. optimizing. By only looking at a single item at a single location, the resulting inventory problem often reduces to a straightforward calculation. Because the single item is being looked at in isolation, it does not consider its effect on the rest of the network. If you open an inventory textbook, you are looking at the single stage calculation that may be supported in a typical APS system. So while the mistake is understandable, it is in fact a mistake to think of these single stage solutions as performing a true optimization. In reality, these solutions simplify the problem to the extent that a single calculation can be performed. This is an improvement over DOS rules of thumb to be sure, but falls significantly short of optimally solving the inventory problem.
Multi-echelon inventory optimization software represents the state of the art approach to optimize inventory levels across the end to end supply chain. These models have significantly more degrees of freedom because they do not assume, like single stage models do, that a specific location must hold inventory. Modeling multiple stages allows other types of inventory, including cycle stock and prebuild along with safety stock due to time phased demands, to now be properly modeled across the supply chain. This seemingly small change opens up tremendous opportunity to improve supply chain performance and lower total inventory.
How does Multi-Echelon Inventory Optimization Work?
When modeling a multi-echelon inventory problem, the objective is to determine the right inventory targets across the entire supply chain. Even if we restrict our attention to a simplistic five-stage supply chain where all the stages form a serial line with Stage 1 as the raw material and Stage 5 as fulfilling customer demand, there are many possible ways to deploy inventory across the supply chain.
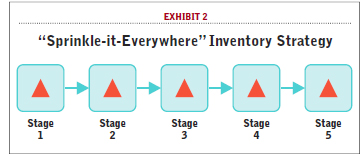 For example, Exhibit 2 depicts a common inventory strategy encountered in practice. In this picture, triangles denote safety stock held at a stage. In Exhibit 2, every stage holds a decoupling safety stock. This allows the actions of a stage to be isolated from other stages. This might be called a “sprinkle-it-everywhere” inventory strategy. However, experience shows that each stage tends to grow its inventories over time, which results in a suboptimal overall inventory strategy from a cost perspective because it does not pool across locations. Instead, each location covers its own lead time.
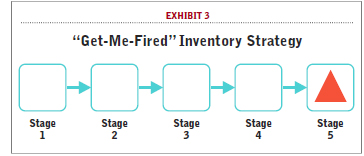 Exhibit 3 represents another extreme. It is pooling in its most extreme form for this simple supply chain. Here, only Stage 5 holds safety stock. This forces the inventory at Stage 5 to increase, versus the situation in Exhibit 2, because Stage 5 must now cover the lead times for all five stages. This removes the safety stock from the other stages because Stage 5 is covering all the lead time in the supply chain. In most real-world cases, this is too much pooling and is problematic because we are now holding safety stock at its most expensive and most differentiated point. So while Exhibit 3 is an interesting thought exercise, it is very unlikely to be the optimal safety stock policy in reality. In fact, it could end up being a “get-me-fired” strategy.
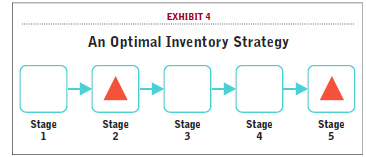 In Exhibit 4 we will assume Stage 3 is the big value add step in the supply chain. In this scenario, a decoupling safety stock at Stage 2 covers the lead times of Stages 1 and 2 while Stage 5 covers Stages 3, 4 and 5. This is an example of what could be the optimal safety stock policy where, through IO, we have placed the right amount of inventory at separate locations to reduce working capital and ensure service levels.
Inventory optimization models at the SKU location level to identify where it is best to hold inventory. This representation is often more granular than how non-supply-chain-people think of the problem. For example, the lay person might think of inventory held at the distribution center as one pile of inventory. Yet the supply chain team has to think of inventory in all its possible states in the DC, because inventory can be held in all three states—for example, raw inventory that has not been processed, packed inventory that has been kitted with other items, and packed inventory that is dedicated to a major channel customer. To produce a feasible inventory plan, all three locations need to be modeled for the purpose of setting tactical inventory targets that can be uploaded into the planning system on a weekly or monthly basis.
It is important to recognize that the inputs to an IO tool can be very modest. The IO data requirements for an inventory optimization tools can focus mainly on the limited list below:
-
Characterization of demand and its volatility.
Service level target.
Stage inventory holding cost.
Stage lead time.
Examples of additional data that can help improve the quality of the result from the IO model are estimates of lead time variability, constraints on delivery performance for stages, and the underlying review periods for different portions of the supply chain.
With the data in the areas listed above, an IO tool evaluates all the inventory stocking levels across the supply chain that satisfy the desired service level requirements. The stocking levels that produce the minimum inventory cost are the optimal inventory policy and the result from the IO tool.
What Do the Results of Inventory Optimization Look Like?
Farasyn et. al (2011) document the application of IO tools at Procter & Gamble.5 Exhibit 5 is a simplified IO model for one product family (liquid makeup) within the total North America Cosmetics supply chain. The chain consists of 8 unique raw materials, 10 blank uncolored work-in-process materials (WIPs), 24 colored WIP materials, 150 packaging materials, 18 intermediate subassemblies (partially assembled finished goods), and 75 finished goods that move from finished packaging on to U.S. and Canadian distribution centers and ultimately to retail customers. Intermediate subassemblies also must satisfy demand for promotional items. In total, the model contains 500 stages (a SKU at a location) and over 700 arcs (bill of materials between SKU locations).
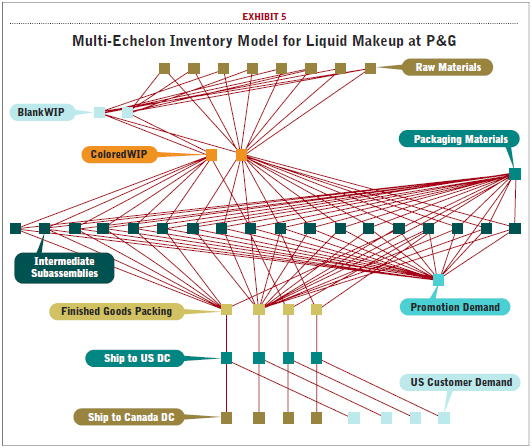
The model incorporated existing service policies (for example, service level target of 99.5 percent case fill rate), material lead times (generally ranging from 7 days to 8 weeks), production times (1-2 days), review periods (7-28 days), transportation and movement times (1-7 days), quality assurance durations (1-5 days), and costs added at each location. Demand characterization (mean and standard deviation) for each finished good SKU was based on the past 13 weeks of actual shipments and forecast, and the future 13 weeks of forecast.
The application of multi-echelon inventory optimization to the Cosmetics liquid makeup portion of its supply chain yielded a change in level and placement of inventory safety stocks while ensuring the target 99.5 percent service level was protected.
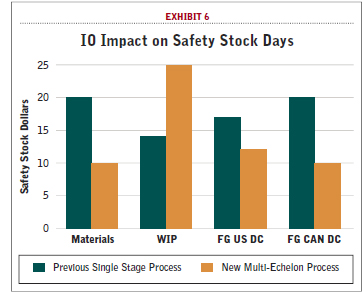 Exhibit 6 provides an overview of the change in safety stock days on hand across the four major safety stock inventory echelons—materials, work-in-process, finished goods in the U.S. distribution center, and finished goods in the Canadian distribution center. Safety stock days decreased in materials and finished goods, and increased in work-in-process.
Most importantly, the total investment in safety stock for this supply chain was reduced by 17 percent, as the dollar drop in finished goods and materials far outweighed the dollar increase in work-in-process. This 17 percent reduction in safety stock equates to a 5 percent total inventory reduction for this product family’s supply chain.
Similar multi-echelon results were achieved by a mid-sized (less than $250 million volume) manufacturer. The manufacturer operates two distinct businesses. One is an import business where the firm operates as a traditional distributor; in the other business, product is manufactured in a two-echelon supply chain consisting of raw materials and finished goods in North America. After IO was applied, at an aggregate level raw material inventory was increased allowing finished goods to decrease. In fact, the total inventory reduction exceeded 19 percent.
Exhibit 7 breaks down the results by SKU. The SKUs are rank ordered by volume, with SKU 1 representing the highest volume product. The inventory results have all been converted into periods of supply. The existing DOS rule of thumb employed either four, five, or six weeks of supply for every SKU. The results from IO are completely indicative of a typical implementation. Namely, a few SKUs actually increase their inventory levels. This is true for SKUs 3, 4, 6, and 11. In fact, when this result was first shared with the planning team, IO was made to look psychic because these were the SKUs that were on the planner’s hot list. But IO is not psychic. IO just sets inventory level based on demand and supply variability, and we all know that some products are more variable than others.
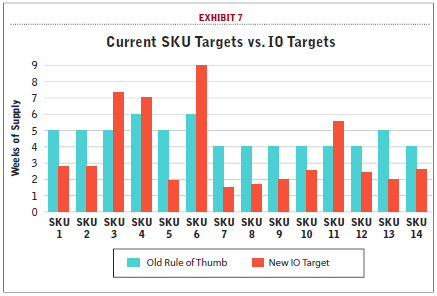
For all the other SKUs, IO recommends lower inventory levels. Again, this should make intuitive sense. Planners manage a hot list on a daily basis. That hot list cannot be infinitely long. If it was, then they would have too little of everything and that can only happen if there is grossly insufficient capacity. So the fact that planners can manage the hot list means, by definition, there must be too much inventory for the other SKUs (because they are not on the hot list that week). Exactly how much excess inventory for the other SKUs depends on its parameters. So while the SKUs differ from company to company, the overall result in Exhibit 7 is common to all companies that implement IO.
Inventory Optimization Best Practices
Setting aside more generic best practices associated with any improvement initiative, there are two specific practices that are critical to successful inventory optimization.
Break Inventory Into its Components
In order to optimize inventory levels, it is necessary to recognize that inventory is not one monolithic quantity. It can be broken into components that exist for assignable reasons. Some of the most important categories of inventory include anticipatory stock, cycle stock, early arrival stock, marketing stock, obsolete stock, pipeline stock, prebuilt stock, and safety stock.
Cycle stock is the inventory due to production frequencies. Early arrival stock is due to uncertainties in coordinated delivery times. Marketing stock is additional inventory placed at customer locations to stimulate demand or satisfy retailer shelf-space requirements. Obsolete stock is inventory of unsalable product that is often left on the books for accounting and finance purposes. Pipeline stock is based on the lead times in the supply chain. Prebuild stock is inventory built ahead of demand due to capacity limitations. There are several classes of safety stock each specific to a type of variability; be it forecast variability, supply variability, or manufacturing variability.
Our list does not fully enumerate all types of inventory. For example, consignment inventories may warrant a separate designation (although they can be considered marketing stock) while some manufacturing processes require curing or another delay step (although they can be considered pipeline stock). Also, promotion stock (in the form of PDQs) have characteristics that make them similar yet different from marketing stock.
It is worth noting that, particularly when it comes to reporting inventory metrics to senior management, it is not necessary to track all of these categories. However, it is necessary to define categories that “move the needle” in terms of supply chain performance. A good rule of thumb is to measure any category that comprises more than 20 percent of total inventory.
Breaking inventory into categories is important for three reasons.
1. Not all inventory is of equal importance to the business. If inventory is not broken into its components, it cannot be tracked or improved. It would not be uncommon for a mid-sized company to have more than 100 million dollars in inventory. If it is just all reported as one giant bucket of costs, then it cannot be improved.
2. The business drivers of the different categories of inventory differ so they cannot all be improved the same way or with the same speed. Different math is required for each category. In particular, the safety stock component, because it is driven by variability in both demand and supply, is the hardest component to solve without a proven multi-echelon inventory optimization model.
3. If a management edict comes down on the first day of the quarter to cut inventory by 10 percent within a month, only safety stock (and possibly cycle stock) can be reduced quickly. All of the other categories (such as prebuild, marketing or obsolete stock) are driven by other factors that cannot be easily or quickly changed—if they can be changed at all. So a 10 percent inventory reduction initiative could translate into a 30 percent safety stock reduction requirement. (These last two points emphasize why IO has grown in importance over the past decade as companies responded to increased volatility in the global marketplace.)
Create a Virtuous Cycle of Inventory Optimization
Inventory optimization operates at both tactical and strategic planning levels, and a virtuous cycle of inventory optimization is created when they operate in concert. At the tactical level, inventory targets are set weekly or monthly based on demand and supply variability. Each time the system is run, it updates its inventory targets based on the updated demand and supply information. So unlike a DOS rule of thumb or a single stage calculation that is run in an off-line mode, the IO system automates the creation of inventory targets on a weekly or monthly cycle. These updated targets free the planning team to focus on only the truly problematic SKUs, because the vast majority of the SKUs will be handled as part of the normal planning process.
At the strategic level, the current instance of the tactical solution is immediately available to answer any questions that arise. In effect, strategic questions that could not be addressed in the past can now be answered “for free” because the data is readily available and the outcome can be implemented in the next run of the tactical solution. In my experience, people vastly underestimate the frequency with which these strategic inventory-related supply chain decisions are made. They are not just made at new product introduction, for example, but every time the product is introduced in every channel in every market in every geography.
Is Inventory Optimization Right for Me?
The simple truth is that inventory optimization is applicable to all but the simplest supply chains. But whether IO is an initiative worth pursuing depends on the relative importance of inventory and service levels versus the other initiatives the company can pursue. To help answer whether inventory optimization is worth pursuing, it is helpful to consider the following questions.
Have you been tasked to:
-
Reduce total inventory by 10 percent or more?
Implement a postponement strategy?
Increase service levels without increasing inventory?
Adjust inventory levels to reflect product-family profitability?
Launch new products more frequently or cost effectively?
Source raw materials or finished goods abroad?
Consolidate manufacturing or distribution operations?
Update inventory targets more frequently than once a year?
Does your supply chain:
-
Experience significant bullwhip effects?
Experience seasonality or end of quarter push?
Consist of more than one location or channel?
Answering yes to any of these questions is a good indication that IO could improve the performance of your supply chain.
In less than a decade, inventory optimization has emerged as a proven technology to drastically reduce total inventory levels while maintaining or improving customer service levels. These competing objectives are satisfied by scientifically accounting for the variability inherent across the entire supply chain and establishing a virtuous cycle of inventory optimization that operates at both the near-term tactical and strategic levels. Born as an advanced algorithmic approach to understanding and quantifying the propagation of demand and supply uncertainties across a multi-level supply chain, inventory optimization is now recognized by leading companies as a core competency critical to their success.
1 Neale and Willems (2009)
2 Billington et al (2003)
3 Neale and Willems (2009)
4 Farasynm et al. (2011)
5 This section is taken in its entirety from the section labeled “Leveraging North America Cosmetics’ Success Across the Beauty & Grooming GBU” in Farasynm et al. (2011)
Bibliography
Billington, C., G. Callioni, B. Crane, J. D. Ruark, J. Unruh Rapp, T. White, and S. P. Willems. 2004. “Accelerating the Profitability of Hewlett-Packard’s Supply Chains.” Interfaces. 34(1) 59-72.
Farasynm I., S. Humair, J. I. Kahn, J. J. Neale, O. Rosen, J. D. Ruark, W. Tarlton, W. Van de Velde, G. Wegryn, and S. P. Willems. 2011. “Inventory Optimization at Procter & Gamble: Achieving Real Benefits through User Adoption of Inventory Tools,” Interfaces 41(1).
Neale, J. J., S. P. Willems. 2009. “Managing Inventory in Supply Chains with Nonstationary Demand,” Interfaces 39(5) 388-399.
About the Author: Dr. Sean P. Willems is associate professor of operations and technology management, Boston University School of Management, and chief scientist, inventory optimization solutions at Logility. He can be reached at [email protected].
More “Inventory Optimization/Management” articles:


