Global Importers Move their Business from West to East Coast Ports

Supply chains radically shift from Pacific to Atlantic ports in the first half of 2015.
Zepol found that a hefty chunk of businesses have switched from using Pacific to Atlantic and Gulf ports this year.
Total imports along the East Coast have increased by 15 percent, while import traffic on the West Coast is down 4 percent.
China is the leading culprit for the supply chain shift.
Imports from China along the West Coast declined by 3 percent, but Chinese imports on the East Coast continue to skyrocket.
Atlantic ports increased containers from China by 20 percent this year, and Gulf ports by a more dramatic 43 percent.
“Shipments are setting sail for Eastern ports even before the Panama Canal expansion is complete,” explains Zepol’s CEO, and trade data expert, Paul Rasmussen. “Shippers may be tired of West Coast backups, and with carriers adding more lines from Asia to the East Coast, it’s hard to blame them.”
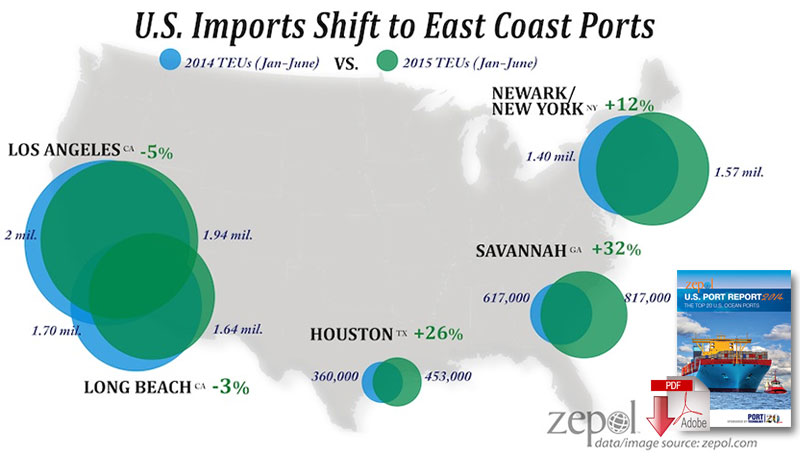
The ports of Newark/New York, Savannah, and Houston had the highest increase in imports for the first half of 2015 (compared with the same time in 2014).
The Port of Newark/New York increased in imports by 12 percent, Savannah rose by 32 percent, and Houston by another 26 percent.
The port of Houston also had a surge in containers from China.
The port brought in 53 percent more Chinese containers already this year.
“Looking at these numbers, the port of Newark/New York’s imports are becoming competitive with Long Beach,” adds Rasmussen. “Upgrades to the Suez Canal and the focus on larger vessel infrastructure at Eastern ports certainly help pull traffic away from the Pacific.”
Top 10 Ports’ Import Volume in 2015 Compared With 2014
| US Port | TEUs (Jan-June 2015) |
TEUs (Jan-June 2014) |
% Change |
| Los Angeles, CA | 1,944,277 | 2,054,137 | -5% |
| Long Beach, CA | 1,640,322 | 1,699,209 | -3% |
| Newark/ New York | 1,578,021 | 1,409,863 | 12% |
| Savannah, GA | 816,585 | 616,948 | 32% |
| Norfolk, VA | 512,914 | 460,186 | 11% |
| Houston, TX | 452,998 | 359,904 | 26% |
| Charleston, SC | 411,848 | 360,886 | 14% |
| Tacoma, WA | 404,478 | 393,006 | 3% |
| Oakland, CA | 383,456 | 400,140 | -4% |
| Seattle, WA | 252,838 | 238,576 | 6% |
| All Others | 1,407,117 | 1,327,942 | 6% |
| TOTAL | 9,804,857 | 9,320,797 | 5% |
Data Note: The data in this report does not include empty containers, or shipments labeled as ‘freight remaining on board,’ and may contain other data anomalies.
Source: Zepol’s Blog of U.S. Imports and Exports
Read: Federal Maritime Commission Gets Real About U.S. Container Port Congestion
Article Topics
Zepol News & Resources
Missing Cargo Ship El Faro, Sank During Hurricane Panama Canal Limits Ship Size Due To El Niño 2015 Ocean Cargo Crisis Calls for Collaboration Global Importers Move their Business from West to East Coast Ports U.S. Port Report 2014 Top 20 U.S. Ocean Ports U.S. supply chains challenged by slowdown in maritime activity Zepol reports February imports hit highest level in four years More ZepolLatest in Transportation
Baltimore Bridge Collapse: Impact on Freight Navigating Amazon Logistics’ Growth Shakes Up Shipping Industry in 2023 Nissan Channels Tesla With Its Latest Manufacturing Process Why are Diesel Prices Climbing Back Over $4 a Gallon? Luxury Car Brands in Limbo After Chinese Company Violates Labor Laws The Three Biggest Challenges Facing Shippers and Carriers in 2024 Supply Chain Stability Index: “Tremendous Improvement” in 2023 More Transportation