Gartner’s 2013 Supply Chain Top 25: Learning From The Industry Leaders
In its nine years to date, the Supply Chain Top 25 has served as a spark for the global discussion and debate that we believe is essential to help constantly push the envelope of innovation for all of us in the supply chain profession.
Gartner recently published its 9th annual Supply Chain Top 25, a ranking of the world’s leading supply chains.
Since the beginning, the ranking has looked to answer one important question: Of the world’s largest companies with the most global reach, which are the furthest along on the journey to being demand driven?
The ranking continues to draw intense interest from practitioners, academics, and publications around the world—a mark of the growing importance of the supply chain discipline.
Our focus in producing this ranking goes beyond excellence to identify leadership in the supply chain, highlighting best practices to help raise the bar for the supply chain profession as a whole.
While there are always some exciting new names on the list, there are some common characteristics that separate the best from the rest.
This article discusses the insights and trends we’ve seen this year from the leaders.
What is the Definition of Excellence?
What does it mean to be demand-driven? Exhibit 1 captures the organizational ideal of demand-driven principles as applied to the global supply chain.
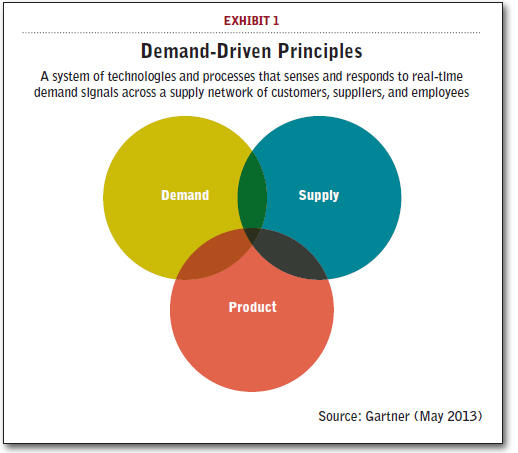
This model has three overlapping areas of responsibility:
- Supply management—Manufacturing, logistics, supply planning, and sourcing.
- Demand management—Marketing, sales, demand planning, and service.
- Product management—R&D, engineering, and product development.
Excellence is about the visibility, coordination, and reliable processes that link the three areas of supply, demand, and product together (Exhibit 2). When that happens, the business can respond quickly and efficiently to opportunities arising from market or customer demand.
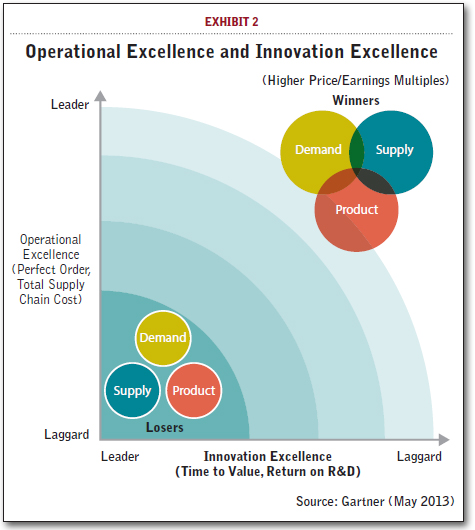
Supply chains built to this design manage demand rather than just respond to it, take a networked rather than linear approach to global supply, and embed innovation in operations rather than keep it isolated in the laboratory. The demand-driven model is inherently circular and self-renewing, unlike the push supply chains of our factory-centric industrial past.
Our methodology is provided in detail below. Here are the basics. Each year, approximately 300 companies are chosen to be ranked. Companies do not apply to be included; rather, we select the companies from publicly available lists using a defined set of criteria, including size and industry sector. Each company gets a composite score, and these scores are then force-ranked to come up with the final list.
The composite score is made up of a combination of publicly available financials, as well an opinion component, providing a balance between objective and subjective perspectives. In completing their ballots, voters are asked to identify those companies they believe are furthest along the journey toward the demand-driven ideal, as defined in Gartner research and on the voting website.
Inside the Numbers
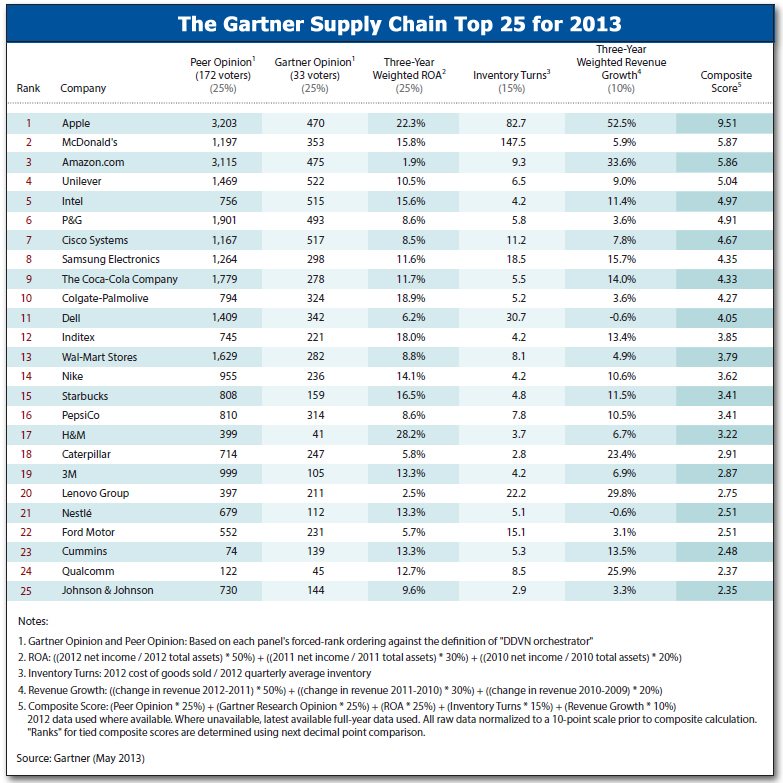
The Top 5 in the ranking this year include two exciting newcomers, Unilever at #4 and Intel at #5. Each has moved steadily up the ranking for the past several years, and with good reason, embodying the essence of what the Top 25 is all about: they have each stepped up to the leadership podium. By sharing their supply chain practices and the lessons they’ve learned with the broader supply chain community, they have helped to raise the level of supply chain performance to new heights.
With a wide range of cutting-edge practices, Unilever is at the forefront of the supply chain maturity curve in many areas, from end-to-end segmentation to an impressive ability to design globally and implement locally across every function of its supply chain.
More importantly, its supply chain innovations have been a critical component of the company’s ability to retain profitable growth, even in the face of sluggish demand in some of its core markets. Chip giant Intel has made significant investments upstream and downstream to enable the broader computing ecosystem. At the same time, Intel has continued its commitment to sustainability and social responsibility in sourcing, having taken a lead role for several years now in the issue of conflict minerals.
Outstanding financials combined with phenomenally strong votes (Apple was ranked No. 1 again by the peer voters, capturing 75 percent of the highest possible points a company can get across the voting pool) allowed Apple to retain the top position again this year. At the same time, the company known for its focus on simplicity has expanded its product portfolio to a broader array of sizes and price points to address increasingly robust competition, driving the need for more complexity management in its supply chain.
In the middle of the Top 5 group and switching places this year are McDonald’s and Amazon. While Amazon far outpaced McDonald’s in the peer vote—Amazon ranked a very close second to Apple’s position in the opinion of the supply chain community—the Top 25 ranking is about more than opinion. We incorporate financials into the methodology as a balancing factor, to reflect a company’s ability to translate supply chain leadership into corporate performance.
While Amazon’s revenue growth has been meteoric, its three-year weighted ROA of 1.9 percent reflects a 2012 net income loss. Compare that to McDonald’s three-year weighted ROA of 16 percent, revealing a robust 20 percent annual net profit margin. This difference, coupled with still healthy respect from the voting community, nudged McDonald’s into the No. 2 slot.
Both have leading practices to share with the supply chain community. McDonald’s stands out with strong new product launch capabilities and excellence in execution consistency. Building its digital portfolio of products and fast crossing lines into new markets, Amazon is a pacesetter across all industries in using its supply chain to set the standard for the customer experience.
Some of the world’s top companies populate slots six through 15 in our ranking, with notable contributions to the discipline of supply chain management. Retaining its position as a supply chain innovator, P&G (#6) continues to define new standards of excellence in segmentation, the use of analytics, and leading sustainability efforts. Rising to #7 this year, Cisco leads the way with a supply chain team focused on revenue growth, enabling the company to break into new markets for its hardware, software, and services-based solutions.
Samsung (#8) and Dell (#11) have each taken collaborative efforts to new heights: Samsung in its emerging markets demand channels, and Dell in its supply networks and intra-enterprise ecosystems of partners. Walmart, another long-time powerhouse, rejoins the ranking this year at #13. Pushing the envelope in integrating supply chain with new product launches are Nike (#14) and Starbucks (#15). Coca Cola (#9) retains strong peer recognition in APAC and Europe, and is focused on reducing complexity while it invests in across the board capabilities of its supply chain talent base.
Both Colgate-Palmolive (#10) and Inditex (#12) have modeled a continued emphasis on efficiency as evidenced by their cross-industry leading ROAs. Both also go beyond efficiency: Colgate with its supply chain talent management and advanced S&OP, and Inditex with its well known commercialization and demand sensing capabilities. These efforts are reflected in the steady rise of both companies since they first appeared in our ranking: Colgate has moved up 10 slots since it joined the ranking in 2009, and Inditex has moved up 11 slots since its first showing in 2010.
This year we welcomed three newcomers in the final section of the ranking. Chinese electronics leader Lenovo (#20), now focused on the integration of supply chain with new product design and release; Ford (#22), the first automotive OEM to join the ranking since 2009, returning to profitability and building a foundation for more strategic global demand/capacity alignment, scenario planning, and risk modeling; and semiconductor Qualcomm at #24, with rapid re-planning capabilities and deep collaborative partnerships with key suppliers.
In the ranking virtually since its inception are Pepsi at #16 this year, and healthcare/consumer products giant Johnson&Johnson at #25. Both continue to lead. J&J demonstrated increasing speed in executing on its compelling supply chain vision, and PepsiCo applied the out-of-the-box thinking embedded in its DNA to breakthrough improvements in its manufacturing technologies and logistics capabilities.
Third-timer Nestle (#21) continues to expand into new markets with high points from its retail customers and an ongoing focus on supply development. Rising two slots to #19, 3M is now looking to balance its long-standing emphasis on product innovation with a focus on network complexity reduction and improvements on the efficiency side of the business in cost, cycle times, and inventories.
Returning to the ranking for the second time are three companies. First, Swedish retail giant H&M (#17) is balancing what has been a truly impressive ROA for five years running with a focus on improving transparency into its emerging market supply base, an important step given the latest challenges for the industry as a whole. Second, leading industrial Caterpillar (#18) is focused on manufacturing and supplier network scalability, and commercialization process velocity.
And third, engine and power generation player Cummins (#23) continues to focus on optimizing across a highly decentralized structure to deliver global scale, with initiatives in customer collaboration, extended visibility, and segmented supply chain strategies.
Characteristics of Leaders
As we can see from the discussion above, every company develops supply chain strategies and priorities that are uniquely suited to its corporate and market context. While these are useful for others to learn from, in our research we also look for the characteristics they share in common.
For many companies, these characteristics are easier to talk about than to actually implement. What differentiates the leaders is that they have moved beyond the words and presentation slides to make the hard changes that are needed throughout the organization.
We’ve talked about many of these in past articles, and they remain relevant:
- an outside-in focus, which requires a fundamental re-orientation not only in mindset, but in the way groups are measured and in the way networks and business processes are designed;
- embedded innovation, which ensures that supply chain considerations are taken into account early in the new product development and launch process, and that supply chain design takes into account that new products require different supply chain strategies than existing products;
- extended supply chains, in which leaders design and manage their supply chains as extended networks of trading partners, orchestrating activities across the network, aligning the goals of all the players, and ensuring profitable delivery of the final product to the customer; and
- excellence addicts, which points to the companies that have figured out how to use metrics effectively: how to focus on the metrics that matter, and even more importantly, how to interpret and then act on those metrics to achieve a desired outcome, namely to continually improve operational results.
The ability to measure and use metrics (Exhibit 3) effectively warrants more attention. Leaders understand which metrics are critical to their ability to see and make
profitable tradeoffs across the end-to-end supply chain.
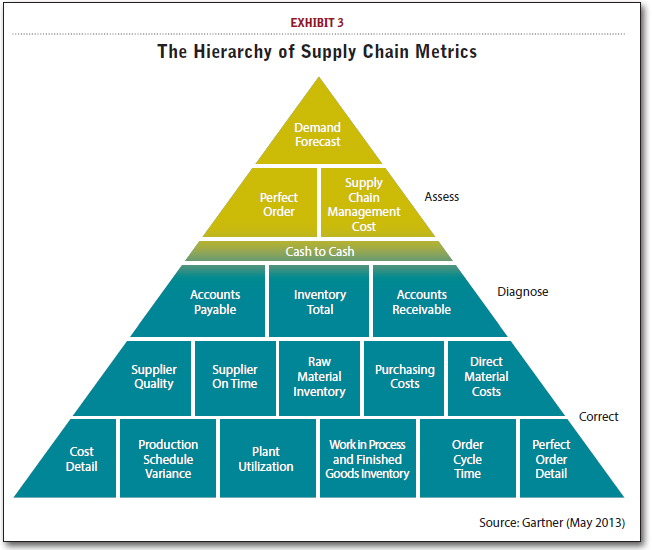
More importantly, they use the metrics effectively: Rather than focusing on one metric at a time, they understand that it’s the relationship between the metrics that makes the metrics actionable.
The best also understand that there are different portfolios of metrics (Exhibit 4) for the different goals and levels, and that there must be tight alignment across these levels. At the first level, supply chain executives need only a small number of metrics for informational purposes and to assess the overall performance of their supply chains.
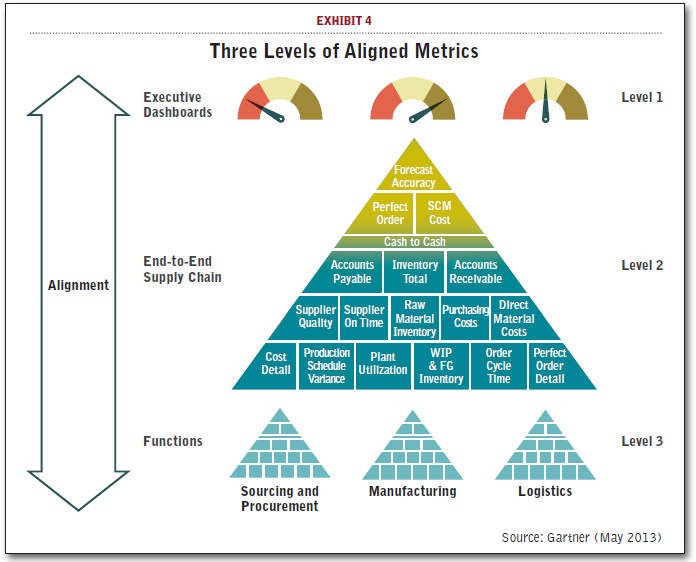
In the second tier are the mid-level, cross-supply chain metrics that allow managers to analyze the performance of the end-to-end supply chain and make tradeoff decisions. The third level contains the detailed functional-specific metrics such as procurement, manufacturing, and logistics, allowing deeper root cause analysis and correction.
But what really differentiates the measurement leaders is this: They understand how to align all the levels. They know that the goal of the supply chain is not just to have the lowest transportation cost, or the highest manufacturing asset utilization, or the lowest procurement per unit cost. The goal of the supply chain is a profitable perfect order, balancing service with end-to-end cost.
The activities of all its components must be aligned in that direction. This means that wise tradeoffs need to be made across the functions; it also means that the goal should not be “best-in-class” on every metric. This requires a fundamental and profound shift in mindset and behaviors throughout the organization. Rather than each function setting its own targets, the goals are set for the end-to-end supply chain and then cascaded down.
So, for example, the question is not: What was our plant utilization last year and therefore what should it be this year? The question is: What is the right level of plant utilization that will allow us to achieve our end-to-end service and cost goals? Lastly, leaders understand that while the metrics are the same, the targets vary for each of the different supply chains they operate.
Trends
Each year, our analysts talk to and research the supply chains of hundreds of companies. Through these discussions, we note certain patterns in the trends on which the leaders are focusing their time and efforts. While many of these don’t change dramatically from year to year, three warrant mention here.
A new frontier of performance. Many companies are working to build out the foundational components of an end-to-end supply chain across disparate businesses, focusing on improving core supply chain functions, and creating more common processes and systems across them. More advanced companies describe a wide range of initiatives that build on the foundation, including end-to-end supply chain segmentation, simplification, cost-to-serve analytics, multi-tier visibility, and supply network optimization.
The leaders are taking it to the next level, stepping further out on the maturity curve of these innovations and deploying the capabilities that are still theory for most. In doing so, they are finding new and creative ways to use these capabilities, exploring synergies and opportunities they hadn’t necessarily anticipated in advance.
For example, leading companies like Unilever are finding synergies in the intersection between simplification, segmentation, and cost-to-serve: Having already focused on reducing complexity in everything from products to organizational structure, processes, and networks, they’re now using cost-to-serve data by segment to optimize rather than simply cut the product/item portfolio, and to ensure profitable growth. Others like P&G, Lenovo, and Caterpillar are finding synergies between S&OP and new product launches to optimize the commercialization process, or between risk management and segmentation to refine resiliency strategies.
A new imperative for smarter growth. This past year, the growth in emerging markets that many companies were depending on to fuel their expansion, has slowed. Developed countries continue to exhibit anemic growth at best and retraction in some markets.
Against this backdrop, we might have expected to see many companies retrench and slip back to focusing their supply chains solely and exclusively on delivering cost reductions and efficiency gains to corporate bottom lines. Instead, leaders are embracing a new imperative for growth, realizing they have to get smarter about how they expand. Whether it’s through reducing commercialization time, flexing the supply chain on packaging or service dimensions, or providing the engine with which new acquisitions can be quickly and easily absorbed, the conversation at companies like Cisco, Intel, and Starbucks has changed from supply chain being about “blocking and tackling” to it being an enabler of company success.
Getting to the heart of talent. Many of the companies we talk to are investing significant time and effort in supply chain-specific talent management efforts, covering everything from expanded university relationships and supply chain certification programs to rotational programs, enhanced career progression planning and multi-channel learning options.
The leaders are going beyond these talent initiatives to get at the fundamentals of motivation, looking to engage hearts, not just minds, and ignite passion for the work that goes beyond mere compliance. They are connecting the dots between the work people do every day and its contribution to the societies within which they live, recognizing that most people not only need to know how they fit into the larger corporate picture, but thrive within a larger aspirational goal.
Whether you are a procurement professional helping to reduce conflict minerals, or a logistics manager looking to cut cost by taking trucks off the road and thereby reducing the global carbon footprint, it’s about the contribution supply chain professionals make to improve the world.
Supply Chain Top 25 Methodology
The way we determine the ranking is something we have been transparent with since the beginning. It’s one of the reasons this list works. We have also sought to keep it both consistent as well as responsive year after year, taking direct feedback from the supply chain community of professionals and incorporating suggested changes into the methodology where possible. As a result, the list reflects not only what Gartner analysts think about supply chain leadership, but what the community as a whole respects.
The Supply Chain Top 25 ranking comprises two main components: financial and opinion. Public financial data provides a view into how companies have performed in the past, while the opinion component offers an eye to future potential and reflects future expected leadership, which is a crucial characteristic. These two components are combined into a total composite score.
We derive a master list of companies from a combination of the Fortune Global 500 and the Forbes Global 2000, with a revenue cutoff of $10 billion. We then pare the combined list down to the manufacturing, retail, and distribution sectors, thus eliminating certain industries, such as financial services and insurance, which do not have physical supply chains.
Financial component. ROA is weighted at 25 percent, inventory turns at 15 percent, and growth at 10 percent. Inventory offers some indication of cost, and ROA provides a general proxy for overall operational efficiency and productivity. Revenue growth, while clearly reflecting myriad market and organizational factors, offers some clues to innovation. Financial data is taken from each company’s publicly available financial statements.
The weighting within the financials has remained consistent since 2010. Prior to 2010, inventory was weighted higher than it is today, at 25 percent. We had considered dropping it all together. As much as inventory is a time-honored supply chain metric—one of the few “real” supply chain metrics on a company’s balance sheet—there have always been issues, not the least of which is that higher turns don’t always point to the better supply chain.
At the same time, it’s a metric that is widely known and understood, both inside and outside the supply chain community. Despite the issues, it’s not entirely invalid as an indicator, particularly if combined with other metrics. Therefore, we left it in, but reduced its weighting.
Since 2009, we’ve used a three-year weighted average for the ROA and revenue growth metrics (rather than the one-year numbers we had previously used), and a one-year quarterly average for inventory (rather than the end-of-year number we had previously used). The yearly weightings are as follows: 50 percent for 2012, 30 percent for 2011, and 20 percent for 2010.
The shift to three-year averages was put in place to accomplish two goals. The first was to smooth the spikes and valleys in annual metrics, which often aren’t truly reflective of supply chain health, that result from events such as acquisitions or divestitures. It also accomplishes a second, equally important goal: to better capture the lag between when a supply chain initiative is put in place (a network redesign or a new demand planning and forecasting system, for example) and when the impact can be expected to show up in financial statement metrics, such as ROA and growth.
Inventory, on the other hand, is a metric that is much closer to supply chain activity; we expect it to reflect initiatives within the same year. The reason we moved to a quarterly average was to gain a better picture of actual inventory holdings throughout the year, rather than the snapshot, end-of-year view provided on the balance sheet in a company’s annual report.
Opinion component. The opinion component of the ranking is designed to provide a forward-looking view that reflects the progress companies are making as they move toward the idealized demand-driven blueprint. It’s made up of two components, each of which is equally weighted: a Gartner analyst expert panel and a peer panel.
The goal of the peer panel is to draw on the extensive knowledge of the professionals that, as customers and/or suppliers, interact and have direct experience with the companies being ranked. Any supply chain professional working for a manufacturer or retailer is eligible to be on the panel, and only one panelist per company is accepted. Excluded from the panel are consultants, technology vendors, and people who don’t work in supply chain roles (such as public relations, marketing, or finance).
We accepted 224 applicants for the peer panel this year, with 172 completing the voting process. Participants came from the most senior levels of the supply chain organization across a broad range of industries. There were 33 Gartner panelists across industry and functional specialties, each of whom drew on his or her primary field research and continuous work with companies.
Organizations must surpass a base threshold of votes from both panels to be included in the ranking. Therefore, a company that had a composite score fall within the Supply Chain Top 25 solely based on the financial metrics would not be included in the ranking.
The regional breakdown of voters continued to be a particular emphasis for us, and we made significant progress this year. In the past, North American voters made up 80 percent of the total, despite many efforts to get a more even regional distribution. We’ve been making steady and constant improvements since then to increase the percentage of voters from Europe and Asia/Pacific.
This year, the improvement was even more robust, providing a more balanced global view of supply chain leadership. For the first time, we had equal representation from Europe and North America, with 38 percent from North America, 38 percent from Europe, and 24 percent from Asia/Pacific. We expect this trend to continue towards fully balanced regional representation.
Polling procedure. Peer panel polling was conducted in April 2013 via a Web-based, structured voting process identical to previous years. Panelists are taken through a four page system to get to their final selection of leaders that come closest to the demand-driven ideal, which is provided in the instructions on the voting website for the convenience of the voters.
Here’s a breakdown of the voting system:
- the first page provides instructions and a description of the demand-driven ideal;
- the second page asks for demographic information;
- the third page provides panelists with a complete list of the companies to be considered. We ask them to choose 30 to 50 that, in their opinion, most closely fit the demand-driven ideal; and
- after the subset of leaders is chosen, the form refreshes, bringing just the chosen companies to a list. Panelists are then asked to force-rank the companies from No. 1 to No. 25, with No. 1 being the company most closely fitting the ideal.
Individual votes are tallied across the entire panel, with 25 points earned for a No. 1 ranking, 24 points for a No. 2 ranking and so on. The Gartner analyst panel and the peer panel use the exact same polling procedure.
By definition, each person’s expertise is deep in some areas and limited in others. Despite that, panelists aren’t expected to conduct external research to place their votes. The polling system is designed to accommodate differences in knowledge, relying on what author James Surowiecki calls the “wisdom of crowds” to provide the mechanism that taps into each person’s core kernel of knowledge and aggregates it into a larger whole.
Composite score. All of this information—the three financials and two opinion votes—is normalized onto a 10-point scale and then aggregated, using the aforementioned weighting, into a total composite score. The composite scores are then sorted in descending order to arrive at the final Supply Chain Top 25 ranking.
Conclusion
In its nine years to date, the Supply Chain Top 25 has served as a spark for the global discussion and debate that we believe is essential to help constantly push the envelope of innovation for all of us in the supply chain profession. We look forward to continuing the journey.
Editors Note: Debra Hofman is managing vice president, Stan Aronow is a research director, and Kimberly Nilles is a research analyst at Gartner Inc. They can be reached at [email protected], [email protected], and [email protected].
Be sure to read the article “Is Apple’s Supply Chain Really the No.1? A Case Study”
Related (very much “related”!): A Final Word On The Gartner Top 25 - Mush!
Article Topics
Gartner News & Resources
Gartner foresees sizeable uptake for next-gen humanoid robots Risk Management: Building resilient supply chains in a risky world Ranking the Top 10 Schools to Learn About Supply Chains Gartner Unveils Top Trends in Supply Chain Technology Major Shift Underway in Logistics KPI Reporting E-commerce Logistics: An endless array of challenges Supply Chain Management (SCM) applications keep the supply chain humming More GartnerLatest in Supply Chain
Microsoft Unveils New AI Innovations For Warehouses Let’s Spend Five Minutes Talking About ... Malaysia Baltimore Bridge Collapse: Impact on Freight Navigating TIm Cook Says Apple Plans to Increase Investments in Vietnam Amazon Logistics’ Growth Shakes Up Shipping Industry in 2023 Spotlight Startup: Cart.com is Reimagining Logistics Walmart and Swisslog Expand Partnership with New Texas Facility More Supply Chain


