Demystifying Inventory Optimization

Inventory optimization is often intimidating and frustrating - once the most common barriers are removed, however, optimized inventory across the supply chain is easier to achieve than it looks.
The pressure to optimize inventory is only increasing.
In industrial business-to-business supply chains, customer service level agreements are growing more stringent, with significant financial penalties for noncompliance.
Meanwhile, brick-and-mortar retailers must successfully manage inventories across their network of distribution centers and stores to compete against Internet retailers.
I often find that inventory optimization intimidates and frustrates people working in supply chain.
They are intimidated because they believe the problem is too difficult to solve. They are frustrated because solving it poorly has a material impact on their lives and operations - not to mention their careers. This is both unfortunate and unnecessary.
This article seeks to demystify inventory optimization so that you can optimize your company’s inventory immediately.
It begins by representing the inventory optimization journey for any company as a progression through three efficient frontiers; companies begin at an ad hoc frontier and then move to a single stage frontier before finishing at a supply chain frontier.
As I’ll demonstrate, the expected results of simply moving from the ad hoc frontier to the single stage frontier are substantial. And, I’ll explain the five impediments to overcome when moving from the ad hoc frontier to the single stage frontier.
The Efficient Frontier for Customer Service Level and Inventory
Let me begin by telling a story about the efficient frontier. The efficient frontier captures the tradeoff between customer service level and inventory. Achieving a higher service level incurs a higher inventory cost. This cost is nonlinear to reflect the reality that each incremental point of service requires more inventory in the network.
In most classic textbooks, the snapshot of the company’s existing inventory-service performance represents a single point on the graph measuring inventory and service. The “optimal” efficient frontier is shown as a curved line that does not touch the current inventory-service performance point.
Exhibit 1, illustrates how we traditionally, and in my view incorrectly, teach the efficient frontier in the context of supply chain management. The implication of this drawing is that without any changes to operating policies, a company could move to some point on the optimal frontier. In this mental exercise, a company can simply improve its customer service level without changing its inventory level or it can maintain its current customer service level and lower its inventory level.
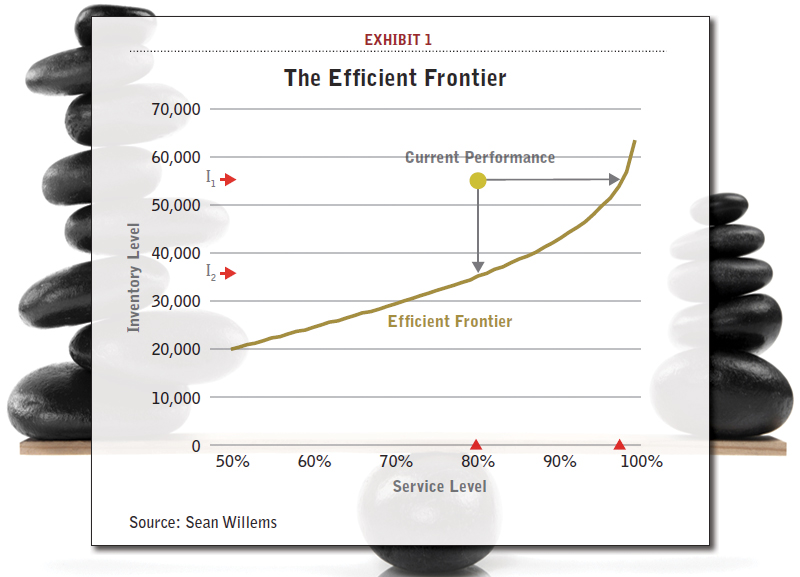
Conventional wisdom incorrectly shows current performance (with inventory level I1 achieving an 80% service level) deviating from the efficient frontier, thereby implying one can easily reduce inventory to I2 while maintaining the same service level, or leave inventory unchanged and achieve 98% service. In reality, moving from existing performance to the efficient frontier is difficult, if not impossible.
As a thought exercise, the picture and story associated with Exhibit 1 sounds good. Reality, however, is far more nuanced. If moving to the efficient frontier was so simple, everyone would just do it. In the real world, we can’t just move from the current point to the efficient frontier because they represent different operating policies. Upon deeper reflection, the key take away is that the current achieved point has its own efficient frontier and there are two other frontiers worth defining and moving towards.
Three Efficient Frontiers
It is more appropriate to think that every company faces three efficient frontiers: the ad hoc frontier, the single stage frontier, and the supply chain frontier. Exhibit 2 shows the three frontiers, and serves as my motivation for writing this article to demystify inventory optimization.
In Exhibit 2, the existing performance still exists as a point on the graph since the company operates today at a specific service level given its inventory investment. That point itself lies on an efficient frontier I call the ad hoc frontier to reflect the reality that the rules to set inventory in the supply chain are likely not rigorously determined. That is, current practices use inventory to meet service level objectives, but these practices are likely informal and not grounded in analytics.
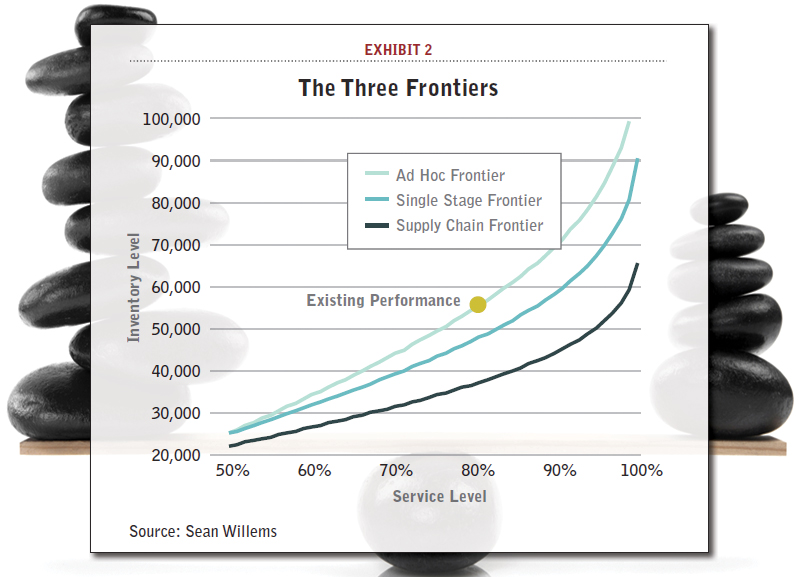
Every supply chain has three efficient frontiers. Existing performance lies on its own ad hoc efficient frontier. By replacing ad hoc inventory targets with single stage scientific calculations the single stage frontier can be achieved. Optimizing across the supply chain achieves the supply chain frontier.
However, without any changes to its operating policies, the same company could move to another point along the ad hoc frontier. For example, using existing policies but lowering inventory levels by 10 percent across the board would result in a lower achieved customer service level.
An entirely new frontier is reached if the company employs single stage inventory calculations for every SKU at every location. Each SKU can be managed as it was under the existing operating policy, but the safety stock target will be scientifically calculated. I call this new frontier the single stage frontier. From an operations perspective, making the change from the ad hoc frontier to the single stage frontier is quite straightforward. All it requires is a willingness to adopt a scientifically derived target. It is worth noting that there is still room for improvement beyond the single stage frontier.
That’s because in moving to the single stage frontier, all we have done is replace the existing safety stock target with a smarter calculation.
The third efficient frontier is the supply chain frontier. In this setting, we now optimize safety stock targets across the supply chain. This requires a new level of communication and management, coupled with a multi-echelon inventory optimization engine, to facilitate the determination and use of the new targets. Whether you move from the ad hoc frontier to the single stage or supply chain efficient frontier is really a cost/benefit decision that is company specific. The focus of this article is to explain why companies have not already moved from the first frontier to the second, and how we can convince them to make that change.
Progressing to Scientifically-based Inventory Calculations
The three efficient frontiers each represent a step in the journey to optimize inventory. The first step is admittedly the most primitive, but, in reality, it is still the most pervasive. More than half of the companies I encounter for the first time in consultations employ rules of thumb to set targets in an ad hoc fashion. The company’s SKUs are partitioned into categories and each category maintains a weeks of supply target. In most cases, the weeks of supply target is a forward weeks of supply target, which means the target safety stock level for every SKU is equal to the sum of the forecasted demands for a future number of weeks.
Academic literature and leading inventory textbooks, such as Inventory Management and Production Planning and Scheduling, agree that an ad hoc weeks of supply target based on future average demand is a suboptimal way to set safety stock targets. Furthermore, basic single stage inventory equations exist that apply to most every SKU at a location.
Don’t worry: There won’t be a math quiz at the end of this article. However, for the case of normally distributed demand and normally distributed replenishment times, the basic single stage inventory equation to determine the safety stock for a SKU at a location is well understood to be:
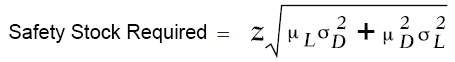
In this example, z is a constant determined by the desired service level for the SKU, μL is the average replenishment leadtime, σL is the standard deviation of the replenishment leadtime, μD is the average demand and σD is the standard deviation of demand. Again, this is not the only single stage safety stock equation, and any good inventory textbook has many variants. However, it is the most commonly encountered in practice and it exists in many commercial inventory planning systems.
Exhibit 3 demonstrates what happens when a company changes setting it safety stock targets from a forward weeks of supply rule of thumb to a scientific single stage inventory calculation.
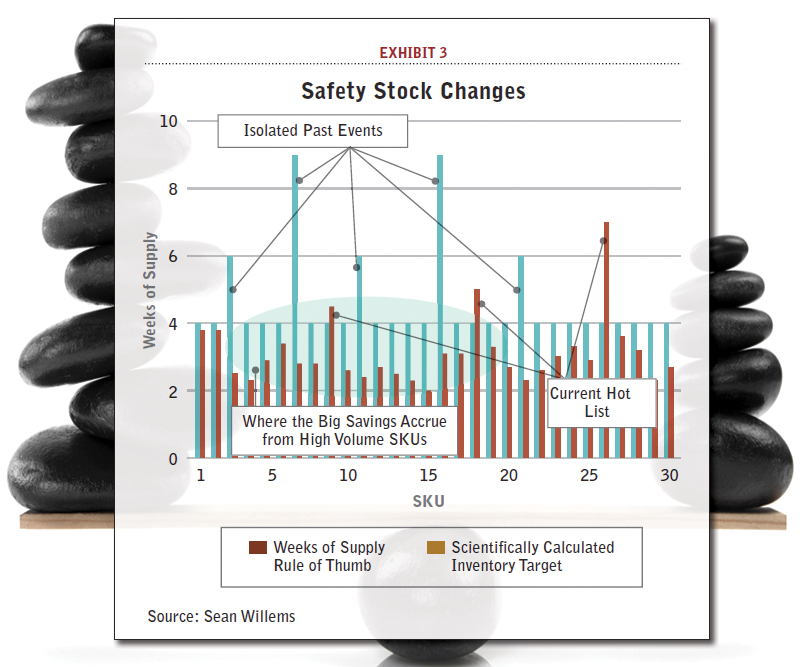
Typical results achieved when changing from a weeks of supply target (depicted in blue) to a scientifically-based single stage safety stock calculation (depicted in red).
The results in Exhibit 3 mirror the results of dozens of projects I have worked on. There are two bar graphs for every SKU, and the SKUs are rank ordered by volume with the highest volume SKU to the left and the lowest volume SKU to the right. The blue bar is the SKUs weeks of supply target. The vast majority of SKUs have a four-week weeks of supply target. Three SKUs have six weeks of supply and two SKUs have nine weeks of supply. Because the SKUs are rank ordered by volume, the SKUs to the left have much higher volumes but because the safety stock targets are translated into time by dividing by average weekly demand all the targets are normalized to the rules of thumb coverage amounts.
The red bar is the scientifically calculated safety stock target; the calculated value (in units) is divided by the average weekly demand to translate it into a forward weeks of supply that can be plotted against the rule of thumb. The scientifically calculated target is driven by variability (and not just the average), so its value is specific to every SKU.
There are several results in Exhibit 3 that hold in general. First, for the majority of SKUs, the scientifically-derived safety stock target is below the forward coverage rule of thumb. This means the existing policy holds too much inventory of these SKUs. This makes intuitive sense; if this were not the case the company’s hot list would be far too large to handle. In effect, if a company maintains a forward coverage rule we can be certain that in aggregate it is holding too much inventory; it is setting the targets with a very coarse filter so it has to set the targets high to not incur problems on a large scale.

Second, the SKUs that had their weeks of supply target adjusted higher in the past no longer need such high targets; whatever event happened in the past is no longer valid and variability has settled back down to a point where the high targets simply create a significant excess in supply for that SKU. This excess inventory situation still exists because companies have asymmetric penalties for having too little and too much stock. Having too little stock causes a planner to get fired or reassigned.
Having too much stock earns a reprimand to go back and lower the stock often without SKU-specific guidance on how to accomplish that goal. Third, there are three SKUs (SKU9, SKU18, SKU26) where the scientifically calculated target exceeds the rule of thumb. These are the SKUs that are currently on the company’s hot list.
When I perform this analysis at a company, I like to combine these second and third results to have some theatrical fun with the team. I walk in and tell them I can guess the SKUs on the company’s current hot list. I begin by talking about the SKUs in the second category. I say: “SKU7 must be causing you problems” and they will respond: “Yes, last year that SKU had a supplier problem and we ran short on it for two months.” They will tell a similar story about something that happened to SKU16 in the distant past. Then I will turn the screws a bit and say “and SKU9 and SKU18 are on your hot list.” If the report is based on the most recent data, this will cause the inventory analyst to blanche while everyone else will just be blank faced.
The inventory analyst blanches because she knows those are two of the three SKUs on this week’s hot list. The rest of the team is blank faced because they have not yet seen the report that tells them this. When done live, this whole exercise is a poignant way to bring the power of inventory optimization to life. In truth, there is no magic in what I am doing. In this example, I know the problematic SKUs are SKU9, SKU18, and SKU26 because those are the SKUs with the highest variability and that variability exceeds the simplistic weeks of supply target that is not equipped to deal with changes in variability. I also know the past problematic SKUs are SKU3, SKU7, SKU11, SKU16, and SKU21 because those are the SKUs that had their weeks of supply targets elevated beyond the norm of four weeks of supply.
As a fourth, and final point, the majority of savings from right sizing safety stock targets (i.e., going from the ad hoc to the single stage solution) accrues from right sizing the higher and medium volume SKUs. Usually the highest volume SKUs are pretty dialed in; there is an inventory analyst monitoring those SKUs all the time. And the lowest volume SKUs often experience significant reductions on a percentage basis but the volumes are too low to matter on a volume basis. It is the higher to medium volume SKUs that move the needle of corporate performance.
Removing the Five Barriers to Using Scientific Inventory Calculations
The above explanation may seem technical and complex. However, moving from ad hoc rules of thumb to scientific single stage inventory calculations is far easier than you may think. Before that can happen, however, there are five impediments that have to be removed to achieve the results in Exhibit 3 at your company. Each impediment is documented and followed by its successful resolution.
First, the intuition for how to correctly solve the problem is completely wrong. Second, corporate metrics reinforce the wrong behavior. Third, people lack faith in the results from a “simple” scientific inventory formula. Fourth, they don’t realize how much money they are leaving on the table by staying with rules of thumb targets. Fifth, they don’t realize the ease with which they can change to scientifically calculated targets. Let’s take them one at a time.
- The intuition for how to correctly determine inventory targets is wrong. If you ask someone to intuitively describe what a proper inventory target should be for a particular item, they inevitably talk about the future, such as what demand will be like in the future. But that is completely wrong. As is well documented in the inventory literature, inventory on hand is a result of supply decisions and materialized demand from the past, not the future.
- Corporate metrics reinforce the wrong behavior. Standard corporate metrics, like weeks of supply, are forward looking. That is, the weeks of supply is calculated by determining how many weeks into the future existing inventory on hand can satisfy. This corporate metric, which has some value, reinforces the incorrect intuition to focus on forward-looking parameters when setting inventory targets. So while we have definitively shown that forward weeks of coverage is a bad metric to use for inventory planning purposes, its value as a corporate metric reinforces its incorrect usages for safety stock target setting.
- People lack faith in the results from a “simple” scientific inventory formula. In supply chain classes we teach students that simple models apply. There are many reasons to like simple models. First, they are understandable. Second, they can be populated with data. Third, the results clearly follow from the inputs. But people can lack faith in simple inventory models. Perhaps they were burned in the past by a different scientific formula (that was likely much more complicated and not generally understood and accepted as correct).
Perhaps they don’t believe the operating decision for their business can be easily reduced to a formula. Whatever the reason, there is often resistance to using formulas in practice. While the above reasons are not valid, there are two concerns with simple models that are reasonable to have but thankfully can be overcome. First, reality can differ from the assumptions in a simple model. Second, even if the reality matches the model assumptions the data inputs can be poor. With forethought, these concerns can be dealt with. If reality differs from the model, find another model; literally every potential setting involving a single SKU at a single location has been reduced to a scientific inventory equation.
If the data is not perfect, take the time to run a pilot with a subset of the data you can confidently estimate. This will show the benefit and the fact that the result is robust to small changes in data. - They don’t realize how much money they are leaving on the table by not changing. Moving from ad hoc forward weeks of supply targets to a scientific inventory equation can reduce total safety stock cost by 10 percent to 30 percent (depending on how bad the original targets were). That is significant reduction that can easily comprise 10 percent of the company’s total inventory investment.
- They don’t realize the ease with which they can change to scientifically calculated targets. The process to replace rules of thumb with a scientific inventory calculation is quite straightforward. The new target simply replaces the ad hoc target so, from a business-process perspective, no changes are required. Because the changes are happening at the location level, the data requirements are also not onerous. This is not an information technology project. A team that wants to rapidly improve inventory levels can do this on their own.
A Journey in Three Steps
Every company undergoes a three-step journey to optimize inventory levels across the end-to-end supply chain. In my experience, the hardest step is moving from ad hoc unscientific weeks of supply targets to more formal scientifically derived inventory targets.
The step from scientific calculation to true supply chain optimized inventory targets is a much easier threshold to cross.
This article has outline the benefits that can be achieved from a typical implementation, and the challenges to overcome.
This is not a hard journey and it can pay significant dividends. If you have not already progressed to the single stage frontier, it is time to get there.
About the Author
Dr. Willems’ develops model-driven supply chain management tools. This includes inventory placement in supply chains, configuring new product supply chains, and setting service levels for multiple customer segments. His multi-echelon inventory research has been a finalist with Hewlett Packard (in 2003) and Procter & Gamble (in 2010) for the Franz Edelman Award for Achievement in Operations Research and the Management Sciences.
The Inventory Optimization Technology Maturity Curve
Ask a number of supply chain teams what Inventory Optimization means and you’ll get a wide range of answers.
Many years’ experience working with leading companies in dozens of industries has revealed a universal IO maturity curve that every organization traverses. It starts with a single SKU in a single location, builds to optimizing inventory across a single site, and so on until the team ultimately creates a multi-echelon inventory optimization model that drives strategy to reach business goals.
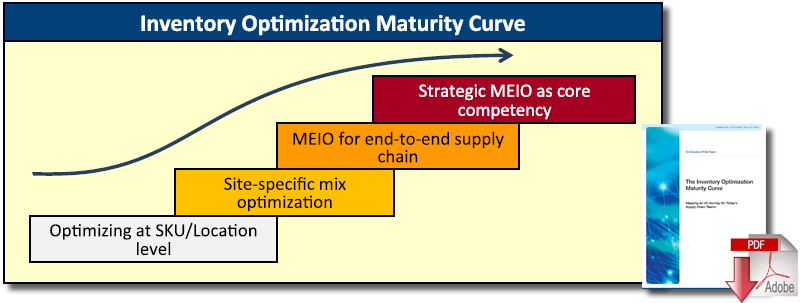
The journey can be divided into four major phases or stages. Your company’s current inventory optimization practices fall somewhere on this curve.
Download the White Paper: Inventory Optimization Maturity Curve
Article Topics
Logility News & Resources
Logility makes entrance into supply chain-focused AI, with acquisition of Garvis Logility Acquires Generative AI Supply Chain Planning Firm Garvis Supply chain software platforms help to level the playing field Logility to acquire supply chain network optimization vendor Starboard Solutions Logility partners with Körber to expand capabilities How Does IKEA’s Inventory Management Supply Chain Strategy Really Work? This is Not Your Father’s Inventory Optimization More LogilityLatest in Supply Chain
How Much Extra Will Consumers Pay for Sustainable Packaging? FedEx Announces Plans to Shut Down Four Facilities U.S. Manufacturing is Growing but Employment Not Keeping Pace The Two Most Important Factors in Last-Mile Delivery Most Companies Unprepared For Supply Chain Emergency Microsoft Unveils New AI Innovations For Warehouses Let’s Spend Five Minutes Talking About ... Malaysia More Supply Chain


