3 Primary Components of Sales & Operations Planning: People, Process, and Technology

The Red Wing Shoe Company details the steps it took to improve S&OP processes, slash its S&OP planning efforts by 50 percent, and align manufacturing with sales - all while growing its business.
Who owns your Sales and Operations Planning process? Is it the supply chain? Is it sales and marketing? Is it manufacturing? Is it your executive team?
Those were questions that we struggled to answer at the Red Wing Shoe Company as we started our journey towards S&OP success.
After speaking to consultants and to other companies like ours at conferences, we knew we were certainly not alone.
Gartner, for instance, has reported that about 70 percent of global organizations are only in Stage 1 or Stage 2 of the four stage S&OP Maturity Model.
Most organizations acknowledge the need for a step-change improvement to their S&OP process.
At the start of our journey, the S&OP process took six weeks to prepare. It was reactive, manual, and primarily a backward looking exercise; much of our planning was based on historical data that we updated by backing out our most recent sales figures from the total projection for the year.
The remainder at the bottom of the column became the figure we expected to sell for the rest of the year. There was little collaboration with our suppliers or manufacturing team to understand their capacities and constraints compared to our forecasts.
We relied on voluminous and complex spreadsheets and updating them was a manual, labor-intensive process that was prone to error. More importantly, nobody in the organization really owned the process or the results.
Over the next several years, we improved our process through a series of steps. In doing so, we tackled the three primary components of S&OP: people, process, and technology.
Along the way, we brought in best practices to reform the way in which we created our forecast and how we finalized our plans. We created new roles for the people involved in demand forecasting and provided training to our team.
Finally, we brought in new technology to automate forecasting and reporting, and to enable supplier collaboration.
There were trials and errors, successes and failures. Through it all, however, a process that once took six weeks is now completed in three weeks. Our forecasts and plans are shared collaboratively with our suppliers and manufacturing group.
More importantly, each of our functional teams is involved in the creation of the plan, which is approved by our senior management and tweaked with input and adjustments from all of our functional areas. We know who owns the process.
The result is that since full implementation in 2012, we are able to accurately forecast for eight manufacturing plants around the world, and generate a forward-looking, 18-month rolling plan. We have reduced inventory while simultaneously improving customer fill rates, entering new markets, adding retail stores, and expanding our portfolio of products.
This Is the Story of the Steps We Took Along the Way to S&OP Success
Increasing Complexity
At Red Wing Shoes, we have a saying: “Work is our work.” The company was founded in Red Wing, Minn., around the turn of the 19th century by Charles Beckman, a local shoe merchant who saw a need for footwear that works - boots that were comfortable but could stand up to the harsh working conditions of demanding industries such as mining, logging, and farming. In 1905, Beckman and 14 investors opened Red Wing Shoes to manufacture and market his unique designs.
Hard work remains the cornerstone of our business; we produce boots for work in the original factory and use Puritan stitch machines that have been in service for more than 80 years. The styles in our Heritage collection are designed and manufactured just as they were years ago, using premium leather from our own tannery. We also manufactured domestically in Potosi, Mo.
Our markets, however, have expanded far beyond Minnesota. Our products protect workers in more than 150 countries across the world, from the Mideast oil fields to the Midwest cornfields. In countries like Japan, which value the American made label, the old work boot look is considered high fashion. We are expanding our warehouse in Dubai to keep pace with a fast-growing market in the Middle East. All told, we manage six brands, including Red Wing Work, Red Wing Heritage, Vasque hiking shoes, Irish Setter Hunt & Work, and the WORX line of boots and shoes. Currently, we forecast for 26,000 footwear SKUs and 72,000 garment and accessories SKUs.

Our supply chain is global and complex. It begins with hides prepared at our own tannery and extends to our company owned Red Wing Shoe retail stores as well as retail partners around the world. In addition to our domestic footwear operations, we manufacture footwear in China and uppers in the Dominican Republic. Garments and accessories are made in Mexico, Pakistan, Vietnam, China, and Poland. We operate distribution centers in Red Wing, Minn., Salt Lake City, Houston, and Dubai, and partner with 3PLs in the Netherlands and Japan. In addition, we direct ship from all of our factories.
We service a network of between 450 and 500 domestic retail locations, ranging from our own corporate owned stores to big box retailers to mom and pop shops; six Heritage stores in Europe and Asia, with more on the drawing board; 50 industrial trucks that deliver to job sites; and 47 B2B showrooms around the world.
The company continues to look at new markets and new products, such as shoes and apparel to address stricter safety regulations for the gas and oil industries in emerging markets. In 2010, we added fire protection gear to our portfolio. What’s more, we are working to position our manufacturing and distribution points closer to the local market to better serve our customers. As we add more customers and products in areas like Africa and the Middle East, we are changing the processes in our warehouses. In some facilities, for instance, customers will pick up full containers of product and transport those to their distribution points. And, as with every other business, all of our customers want it yesterday.
Taken as a whole, we have more items to forecast; more factors that can influence a forecast than in the past; and S&OP is more important than ever, especially as we try to do an effective job of managing inventory while improving our fill rates. It’s still all about having the right product, in the right amount, in the right place, and at the right time.
Spreadsheets, Errors, and Meetings
In 2008 the author of this article was hired to lead a reimplementation of the S&OP process. At the time, there was a planning process in place, but it was less than optimal. A planner and a representative from product development created a yearly forecast broken out by month. The forecast was based on the prior year sales and what we thought might happen in the next year. It was updated once a month in a small meeting.
For example, if we originally forecast to sell 1,000 units of a style and moved 700 units through the first eight months of the year, we updated the plan to reflect projected sales of 300 units over the last four months. Changes to the forecast, or the reasons for changes, weren’t tracked. A spike in demand for a certain style, for instance, might lead to a new increased forecast. However, we rarely investigated to determine whether the spike in demand was a sustainable surge in interest or a one-time fluke.
Execution of the plan was driven by our supply chain and not the sales department. If inventory was out of line with what was selling, or where it was selling, we often ended up storing the excess in trailers or containers in the yard until we freed up space in the warehouse. That practice resulted in high demurrage charges. At the end of the day, no one organization owned the process or was responsible for the outcomes.
We took the first steps towards changing that dynamic in 2009. One of those steps was to create a spreadsheet for each of the company’s brands. We also created the initial framework for more inclusive S&OP meetings, with representatives from different functional areas within the company, including executives, supply chain, product development, and sales managers from our various brands.
The participants included Mallery Dosdall, who was then part of the retail organization and is now the manager of demand planning. The meetings might include more than a dozen individuals and sometimes lasted for three hours.
These were important first steps along our journey. However, there were still a number of drawbacks that limited our effectiveness. For starts, forecasting remained in the hands of product development and planners. And, it was still reactive and manual. Moreover, it was time consuming. Gathering and inputting the data into the spreadsheets took two or more weeks.
The spreadsheets were complex, clunky, and voluminous; we needed over 450 pages to forecast across all brands and styles. If an executive had a question about a brand or style, it could take hours to ferret out the information. Given the number of brands, styles, and warehousing and manufacturing locations, it’s no surprise that the process of manually inputting the data was prone to error.
As an example, there was an instance where 20 new styles were added to one spreadsheet. Each of the new styles was available in 40 to 50 different sizes. While inputting the data we forgot to add the subtotal to the top of the spreadsheet. The net result was that planned capacity at the production lines based on the forecast was insufficient to meet actual demand.
In retrospect, the first S&OP meetings were also too large - and too long - to be effective. Like the forecast, the meetings were often a look back at what had just happened since the last meeting rather than a look ahead at what should happen. In all, the process of forecasting and approving a plan took 6 weeks. By the time a forecast was sent to suppliers and to manufacturing, it was already dated.
At the same time, there was little collaboration with suppliers and manufacturing teams. We rarely asked them if they had the capacity to produce what we needed and when we needed it. Nor were they provided with a forecast. We simply issued a PO for what they were expected to produce and the date for when it was due. Unless someone from manufacturing was communicating directly with the sales team, corporate didn’t know whether the factories would meet their production requirements or their ship by dates.
The sense from the S&OP team was that there was still room for improvement.
A Step in the Right Direction
In late 2010, we took the next step in the right direction to improve the process. With the help of our IT department, we created a process to automatically pull data from our ERP system and populate a new spreadsheet. That meant that we no longer had to spend two weeks just keying in data. By automating some of the process, we reduced the number of errors - however, we still had to key in changes from the spreadsheet back into the ERP system, which was prone to mistakes.
Although they were still voluminous, the spreadsheets were easier to work with. In addition, the team began meeting with the head of sales and other representatives for each brand to get more accurate data about what was selling and why, including Dosdall who was then still with our work brand. The meetings were still long, but the team now had the ability to see year-over-year demand and had a more complete picture of data. This new approach, combined with more accurate spreadsheets, was a significant improvement.

Still, our business was growing, further complicating the task of forecasting. By early 2011, it was clear we needed to increase our visibility into our true demand and provide more reliable plans to suppliers and manufacturing if S&OP was going to effectively support the growth plans we had for the business. To learn more about best practices, Dosdall and Grothe attended an S&OP conference sponsored by the Institute of Business Forecasting & Planning (IBF) and led by the consulting firm Oliver Wight. The two attended other S&OP conferences as well, such as the Best of the Best S&OP conference put on by IBF and APICS.
Following these events, they developed ideas on ways to evolve from a backward-looking to a forward-looking organization. For instance, they wanted to create manufacturing capacity graphs and to provide suppliers with better forecasts. The idea was to take actual sales data and use that to forecast at the level of the production line. They would then work with manufacturing to ensure that forecasts aligned with capacity.
Dosdall and Grothe presented a proposal for a new approach to S&OP. To illustrate the challenges of forecasting, they recreated an exercise from one of the conferences. Participants were handed bags of M&Ms and asked to forecast how many M&Ms were in the bag and to predict the distribution by color. No one got it right, not even one clever executive who called the 1-800 number on the back of the pack to speak to the candy manufacturer. The point was made: If you think estimating the number of M&Ms in a pack by color is tough, try forecasting across tens of thousands of SKUs with limited visibility.
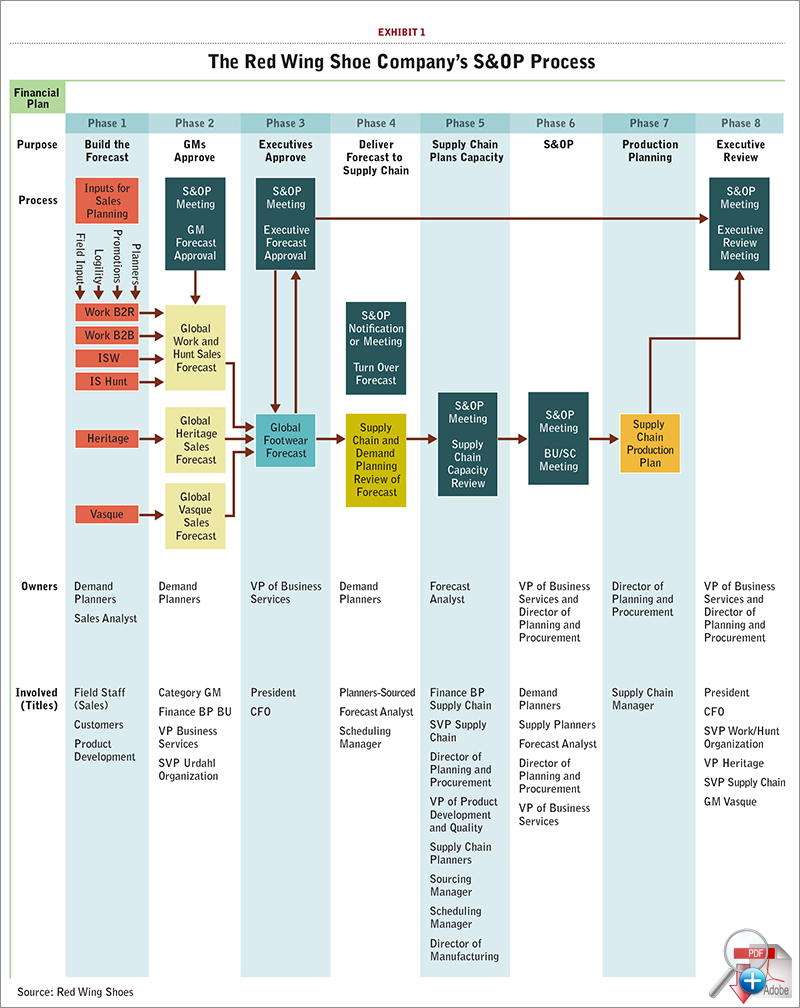
Two important changes came out of the proposal. The first was a commitment to redesign S&OP meetings from one large inclusive event into smaller meetings divided by functionality. The idea was to create a forecast based on consultations with each brand and then separately review and refine the plan with functional areas, such as manufacturing, distribution, and transportation. That forecast could then be massaged by the sales department based on the capacity constraints in the supply chain. If everything couldn’t be manufactured, what was sales’ priority? If there was too much capacity, could sales run a promotion to move more product? Did manufacturing need to add a second shift? Once that plan was complete, it was reviewed by the executive team. (See Red Wing Shoes’ S&OP Process.)
A second outcome was to evaluate the people involved in S&OP. For instance, we created a new demand planning position - this was an individual who would work directly with each brand to analyze data, input information from the sales groups, and formulate a better process. That role was initially filled by Dosdall. She began holding conference calls with domestic and international sales regions. During those calls, for instance, she might learn that the Northeast had been really wet and that waterproof products might be in more demand. That information became part of the statistical forecast. Since then, we have added additional members to the team and now have five demand planners, including Dosdall who manages the team.
We had been holding weekly conference calls with suppliers and manufacturers as part of a lean manufacturing and warehousing initiative since 2009. Now, we could provide better sales and forecast data during those conference calls; we also got a better understanding of how each of these areas was producing and their constraints. By collaborating with our partners, they too became part of the S&OP process and shared in the forecast.
Demand Planning Made Easy
At the end of the day, S&OP is a process and not a technology. However, demand planning is made easy by technology. Although we were refining our processes and redefining the roles of our people, we were still working with spreadsheets.
To take the initiative to the next step, Grothe attended an APICS conference in Toronto to learn about software forecasting tools designed to streamline the S&OP process.
After a vetting process, Red Wing Shoes settled on a software application from Logility. The implementation process began in late 2011; the demand planning module went live March 2012, and was followed by inventory management and replenishment two months later in May.
5 Steps to S&OP Success
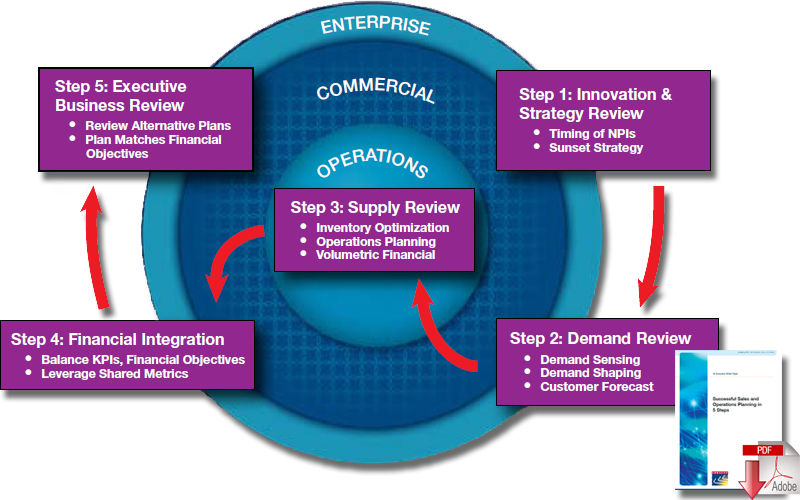
The 5 critical steps and the interaction with each other to create a consensus plan for a company to follow
As we were preparing to work with the new technology, we realized we were making significant changes to our organization. To prepare our staff, we sent a key group of stakeholders to a course on planning and forecasting tools offered through APICS.
This group not only learned how the new software tool was going to work, the members also learned how a change in one of the parameters, such as safety stock or bumping up a forecast, had an effect on manufacturing and distribution. We felt this type of change management and training was essential if our people were going to make the best use of the software and the new process.
During the implementation, we populated the software solution with three years of demand history. Once the tool went live, the old clunky spreadsheets were replaced with streamlined, dynamic views of the business, including global visibility by brand and company. It took about three months for our organization, our suppliers, and our manufacturers to trust the data, but soon they became convinced that the data was solid.
Since then, we have realized a number of benefits:
- The S&OP process itself has been cut in half, from six weeks to three weeks.
- By populating the software solution with three years of demand, planners can take a deeper dive into the history of a style or SKU and apply statistical methods to forecasting.
- When we were using spreadsheets, it could take days to answer a question for senior management, like the sales demand for waterproof styles from a specific factory. Now, reports are available in minutes.
- The system allows planners to manage by exceptions. While every style is reviewed at least once a quarter, the system is set up with alerts that let a planner know in between reviews if they’re missing their forecast or if we are selling more than our forecast.
- And, suppliers and internal stakeholders trust the data. Our suppliers tell us it’s the best information they’ve ever received.
The most important outcome of the new approach to forecasting and planning may be that we were able to finally answer the question of who owns the process: Supply chain owns the tool and prepares the forecasts; the brands own the sales; sales owns the inventory; and so on. It was all geared towards making certain that manufacturing had accurate sales forecasts that were also in line with their capacity and ability to ship the right product to the right stores at the right time.
After working with the system for the last two years, inventory has been reduced by 27 percent while customer fill rates have been improved by 8 percent to 10 percent. Those pesky demurrage charges have been decreased by 50 percent - all while growing the business.
The impact on the company was summed up by one senior executive shortly before the system went live: “This will be a game changer for us.”
Indeed, we could not have added the number of new products or entered the number of new markets we have taken on with our old spreadsheets and old S&OP process.
Article Topics
Logility News & Resources
Logility makes entrance into supply chain-focused AI, with acquisition of Garvis Logility Acquires Generative AI Supply Chain Planning Firm Garvis Supply chain software platforms help to level the playing field Logility to acquire supply chain network optimization vendor Starboard Solutions Logility partners with Körber to expand capabilities How Does IKEA’s Inventory Management Supply Chain Strategy Really Work? This is Not Your Father’s Inventory Optimization More LogilityLatest in Supply Chain
Microsoft Unveils New AI Innovations For Warehouses Let’s Spend Five Minutes Talking About ... Malaysia Baltimore Bridge Collapse: Impact on Freight Navigating TIm Cook Says Apple Plans to Increase Investments in Vietnam Amazon Logistics’ Growth Shakes Up Shipping Industry in 2023 Spotlight Startup: Cart.com is Reimagining Logistics Walmart and Swisslog Expand Partnership with New Texas Facility More Supply Chain


