2018 Warehouse / Distribution Center Survey: Labor crunch driving automation
The combined forces of a strong economy, e-commerce growth and a tight labor market are making it more important for distribution center (DC) operations to find ways to make their existing infrastructure and people more productive. Software and automation continue to prove to be a vital part of the solution.
The findings from our “2018 Warehouse and Distribution Center (DC) Operations Survey” cascade from strong economic growth and a tight labor market on the one hand, and e-commerce growth and order fulfillment complexities on the other. Strike these mega-trends against each other like flint against steel, and sparks will fly.
In fact, the labor crunch grew further as the No. 1 issue in the survey, while respondents report increased use of warehouse management systems (WMS) and other software, additional automation, and greater use of metrics and more advanced picking methods to cope with these challenges.
A few of the highlights include:
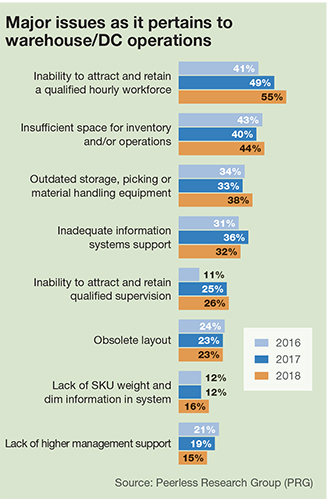
- inability to attract and retain a qualified hourly workforce was the leading industry issue, cited by 55% of respondents, up 6% from last year;
- the third year of asking about omni-channel fulfillment, 21% now say they have an omni-channel operation, up from 19% last year, while 40% say they support e-commerce fulfillment;
- and use of some type of warehouse management system (WMS) reached 93%—the first time that response topped 90%.
The survey, conducted annually by Peerless Research Group on behalf of Logistics Management and sister publication Modern Materials Handling, drew 138 responses this year from professionals in logistics and warehouse operations across multiple verticals. According to Norm Saenz, Jr., a managing director with St. Onge Company, and Don Derewecki, a senior consultant with St. Onge Company, a supply chain engineering consulting company and our partner for this annual survey, respondents are clearly seeking to apply technology to address the mounting pressures.
“With the increased transactional volumes most everyone is experiencing, and the real push into e-commerce…when those factors come up against the lack of labor resources and the competitive nature of the market, you simply have to find ways to gain efficiencies,” says Saenz.
 Derewecki agrees that growing volumes, difficulties in finding labor, and more piece picking as part of e-commerce are certainly driving increased use of automation, but adds that operations also need automation to help meet complex customer requirements under tight time windows.
“More piece pick versus case pick is driving change, but it’s also all the value-added services that have to be incorporated into processes,” says Derewecki. “Even if you can get orders out the door on time, that’s not good enough. It really does have to be a perfect order that gets done under a narrower time window with scarcer resources of all types throughout the network.”
Most participating companies in 2018 came from manufacturing (40%), followed by distributors (26%), third-party logistics (3PL) providers (15%) and retailers (9%). Leading verticals included food and grocery, paper and office supplies, apparel, and building, construction & HVAC materials. Average revenue size of respondent companies trended significantly higher than in recent years.
Operations snapshot
As to be expected given the growth of e-commerce, full-pallet only profiles are rare. For 2018, only 10% are full-pallet only on the inbound side, down from 13% in 2017, and 10% on the outbound side, down from 14%.
This year was the first for offering split-case only as an answer for describing outbound operation, with 5% of respondents being split-case only. If you combine that 5% with the 13% doing case and split-case outbound, and the 48% doing full pallet, case and split-case outbound, two-thirds are doing at least some split case on the outbound. Considering that 40% of the respondents were manufacturers, this level of split-case shipping is significant.
Wholesale remains the most common channel serviced (66%), followed by retail (54%), both at levels just slightly below last year. This year, 40% of respondents service e-commerce, up from 37% last year, while 21% have omni-channel responsibilities, up from 19% in 2017.
The ways that channels are being fulfilled saw an increase in the use of 3PLs for all channels, which rose from 8% last year to 14% this year, the highest since 2015. Another 7% use a 3PL for e-commerce, same as in 2017. Those saying they self-distribute via separate DCs for different channels dipped, falling from 30% last year to 24% this year.
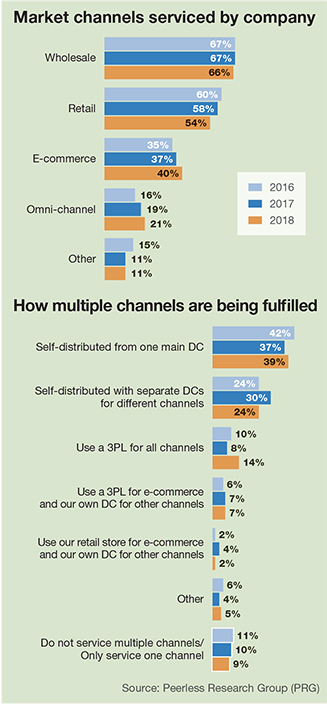 Given the growth of e-commerce and business volumes in general, the need to tap into 3PLs is understandable. As Saenz notes: “While use of certain automation and software is up in the survey to service an expanding customer base and be competitive globally, many companies need to use a 3PL to keep up.”
The survey’s findings on inventory are in keeping with e-commerce characteristics in which order velocity is high and a wide assortment of SKUs need to be held to satisfy demand. For 2018, the average number of SKUs reached 13,985, up from 13,130 last year. Additionally, when asked roughly what percentage of SKUs are conveyable or could be handled robotically, respondents’ average answer was 43%, up from 29% last year.
Inventory turns did rise slightly—reaching an average of 8.9 annual turns, up from 8.5 in 2017. While increased turns are expected as part of inventory control efforts, many factors can make it harder to increase turns, notes Derewecki, including the competitive landscape, the current issues with tariffs, and e-commerce growth, which tend to lead to more SKUs and some inventory buildups.
Space and labor trends
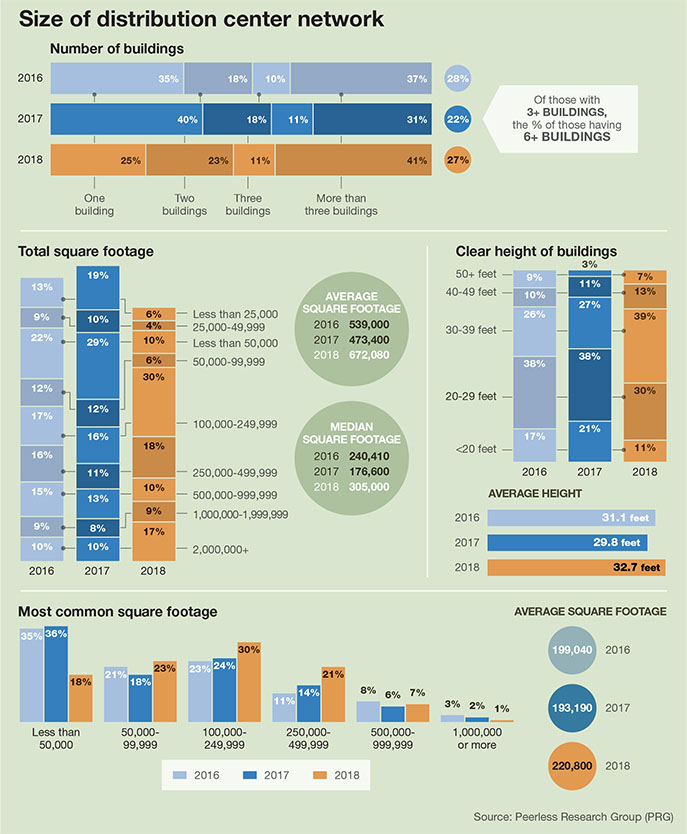
The response to a growth economy is also seen in the trend toward bigger, taller facilities. For instance, average square footage for the total DC network reached 672,080 square feet, well over last year’s 473,400, while the median grew from 176,600 to 305,000 square feet. While this year’s respondents tended toward larger companies, when combined with other findings on growing space needs, it reflects the need to add space to serve growing volumes.
In other space related findings, clear height is up. This year, the average height reached 32.7 feet, up from 29.8 feet, and more consistent with the results of the previous two years which also topped 30 feet.
When it comes to expansion plans, 76% have planned some type of expansion (e.g., number of employees, SKUs, square footage, number of buildings), versus 71% last year. There are 23% planning to expand the number of buildings, up from 17% last year. With SKUs, 33% expect more SKUs, up from 29% who did in 2017. With labor, 33% plan for more employees, down slightly from 36% in 2017.
Average space utilization was 78.3% for 2018, though 40% report average utilization of 85% or greater. The average peak space utilization came in at 86.3%, but again, many reported higher rates, including 36% with peak utilization of 95% or higher.
Trends like the need for more space, more SKUs, somewhat lower turns anticipated, as well as greater use of 3PLs, all point to an unrelenting scramble to keep up with general business demand and more e-commerce, explains Saenz. “These findings are consistent with the need to support e-commerce and reach customers faster,” he says.
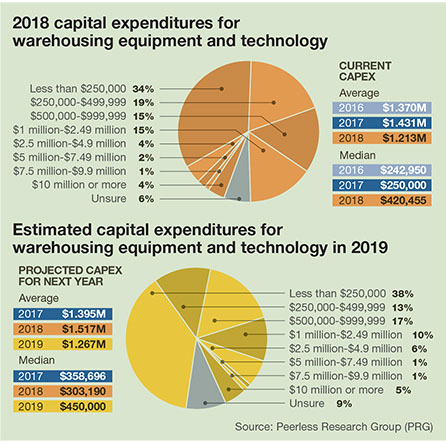
Capital expenditures (CapEx) trends broke somewhat from other expansion patterns. Average CapEx for 2018 is $1.21 million, down from $1.43 million last year, though the median CapEx for 2018 reached over $420,000, up from $250,000 last year. Similarly, when asked about projected CapEx for 2019, the average was $1.26 million, down from $1.5 million in 2017, when median projected CapEx was $450,000 up from $303,000.
To some extent, the variation in CapEx trends from 2017 to 2018 is simply due to a different respondent mix. Other factors that may be involved include not counting spend on 3PLs as CapEx, as well as the possibility that, after healthy CapEx outlay in recent years, some companies may be scaling back a bit on core infrastructure while still layering in some additional automation. The growth in median figures on CapEx, meanwhile, is tied to a slightly larger percentage of respondents with fairly large projects.
For 2018, the average number of employees in respondents’ main warehouse stood at 182 employees. Additionally, when asked about expansion plans, 33% said they would expand headcount, down slightly from 2017’s 36%.
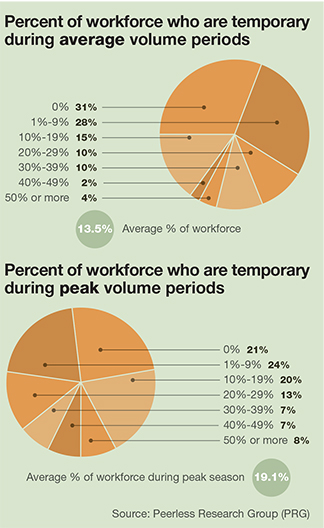
For this first time in this annual survey, questions were asked about use of temporary workforce. During normal volume periods, on average 13.5% of the workforce are temporary, whereas during peak periods, 19.1% are temps. Of course, for some respondents, that percent was higher during peak, with 8% saying 50% or more of the labor force was temporary.
These average percentages regarding temporary workforce may seem low, but are still significant, given that many respondents are smaller operations that may have more manageable staffing needs. As Saenz points out, when you look at other findings in the survey such as the adoption rate for productivity enhancing technologies, and the finding that the inability to find qualified workforce is the leading industry challenge, “clearly the lack of adequate labor resources is on everybody’s mind.”
Applying more tech
Continued strong numbers around the use of software and other productivity enhancing technologies where a couple of the top highlights of the survey. Not only was 2018 the first year WMS adoption topped 90%, use of paper-based picking systems dropped from 62% last year to 48% this year—the first time that use of paper-based picking dropped below 50%.
Other picking technologies and methods on the rise include RF-assisted with scanning, up by 9% versus 2017, and voice assisted with scanning, which reached 12%, up from 7% last year. Voice systems with no scanning came in at 10%, so this year 22% are using some form of voice-directed solution.
Included within the “some type of WMS in use” question were various options, including legacy WMS, best-of-breed WMS, ERP with a WMS module, and for the first time, warehouse control or warehouse execution system (WES). While the WES choice garnered just a 6% response, best-of-breed WMS increased 6% to reach 19%, while use of legacy WMS was at 43%, and ERP with a WMS module at 33%.
Other findings on the software/WMS question included labor management systems (LMS) adoption climbing by 3% to reach 15% this year, slotting functionality now in use in 10% of respondents, and some type of Cloud or on-demand solution now in use by 9%—up from 5% last year.
While a question about materials handling systems in use indicated continued widespread use of some manual processes, use of automated storage and retrieval grew 2% to 12%, while in the first time asking about palletizers, 19% said that they use them.
A question on “order-filling techniques in use” also points to further adoption of methods enabled by WMS. Zone picking is in use by 34% of respondents, up from 27% last year, batching picking is in use by 46% of operations, and put wall systems are used by 9%—up from 4% last year.
It’s probably no coincidence, note Saenz and Derewecki, that many of the growth technologies help squeeze more productivity out of that hardest to find DC resource today: hourly floor associates. “You need to have higher productivity rates for the people you do have because you can’t count on being able to hire another 10-plus people,” says Saenz.
Another way to squeeze more throughput from available resources is to use metrics to track and improve performance. Here too, the 2018 survey shows greater adoption, with the percentage of respondents using some type of productivity metric reaching 90%, up from 86% in 2017.
Types of metrics that saw increased use this year included orders per hour, case per hour, lines per hour, and percentage of an engineered standard. In a separate question, 62% of respondents indicated data collection used to gauge productivity is automated via WMS, up 2% from last year, while reliance on manual methods of data collection fell by 2%.
“The higher use of metrics reflected in the survey is a critical and very encouraging finding because it shows that more and more people are managing their businesses more closely to improve productivity, enhance operational controls and reduce costs,” says Derewecki.
Respondents took a range of actions to lower operating costs, including improving processes, improving warehouse information technology (IT), improving inventory control, and leveraging a 3PL. While 98% took actions of some type, one type of action that increased sharply was to improve warehouse IT, which climbed from 38% last year to 50% this year. Using a 3PL also climbed to 15%, while a new option, “adding automated equipment to processes,” also drew a 15% response.
Labor crunch dominates
E-commerce fulfillment requires significant labor if a DC isn’t highly automated, and with a long stretch of economic growth, unemployment has reached lows not seen for decades. These factors make the inability to find qualified hourly workers, already the leading operations issue last year, an even bigger concern in 2018, the survey finds.
This year, 55% of respondents named labor scarcity as the top issue, an increase from last year’s 49%. In descending order, the other top issues for 2018 are insufficient space (44%); outdated storage, picking or material handling equipment (38%); and inadequate information systems (32%). Only on this last issue of IT system capabilities did respondents rank it lower than they did last year, when it drew a 36% response.
 For 2018, 87% of respondents report doing some type of value-added services (VAS), down slightly from 2017’s 90%, but consistent with findings from the previous couple of years. Frequently cited types of VAS include special labelling (87%), special packaging (48%) and lot number control (37%), kitting (33%), serial number control (22%), and special display building and packaging (25%).
The percent of respondents who report that their systems have SKU weight and dimension data in their item masters went up to 76% this year from 64% last year. However, 16% see lack of DIM weight data as a major issue, up slightly from the previous year.
Another rise—and this one not a welcome development—is that 19% of organizations reported this year that their supply chain experienced a catastrophic event within the last two years, up from 15% who said yes to this question last year.
A few trends have been building in the survey response the last three years. For example, there has been growth in volume and in SKUs, as well as expanding space needs. The last few years also have more implementation of automated systems, from RF scanning and voice systems, as well as more highly automated solutions like AS/RS, and some modest uptake of robotics.
While there is no single cause for all of these shifts, they are generally being driven by strong business and e-commerce growth coming up against difficulties in finding enough labor.
One final thought regarding the labor crunch: The 2018 survey was already closed when Amazon announced in early October it would make $15 an hour its minimum wage for U.S. employees. Certainly, when one of the biggest employers of warehouse workers bumps up its pay rate, the labor crunch becomes even more top of mind for other employers.
In the end, it’s a safe bet that finding ways to offset labor needs by making operations more efficient will continue to be a focus in the years to come.