2016 Warehouse/DC Operations Survey: Ready to Confront Complexity
Survey respondents indicate a desire to apply more IT solutions and keep up on capital expenditures as they confront complex issues like bigger facilities, labor issues, high SKU counts and the growing reality of omni-channel.
As it has the last few years, our “Annual Warehouse and Distribution Center (DC) Operations Survey” points to growing order fulfillment complexity, larger labor forces, and other challenges associated with e-commerce. However, the 2016 survey reflects an industry that’s not only well aware of these challenges, but one that’s poised and ready to do something about them.
From tweaking operational processes, to tapping labor as a means of flexing capacity, to incrementally applying more technology, the survey clearly indicates that respondents are in the midst of addressing omni-channel challenges. For example, capital expenditure (CapEx) levels have kept pace with CapEx growth seen in recent surveys, and workforce numbers held steady or grew among some respondents.
According to Donald J. Derewecki, a senior consultant with St. Onge Company, and Norm Saenz, Jr., a managing director with St. Onge Company, a supply chain engineering consulting company and Logistics Management’s partner for this annual research, a majority of the data points to an industry engaged in confronting omni-channel complexities.
“As operations requirements become more complex, companies in general seem to be coping,” says Derewecki. “E-commerce has been affecting nearly everything. Even companies that don’t directly participate in e-commerce now experience Amazon-type expectations from customers about rapid ordering and fulfillment. So the bar is set pretty high on requirements, and in response, the majority of respondents seem to be focused on improving their processes and the information systems support for those processes.”
While the survey indicates only modest increases in information technology (IT) use or plans, there were increases across certain IT and materials handling automation solutions, while reliance on paper-based processes continued its slow decline.
“I feel the trends are continuing, and that companies are doing a little bit more to meet the demands of e-commerce and omni-channel growth,” says Saenz. “It was encouraging to see in the survey that more companies, in addition to their focus on process improvement, are looking to apply more technology and spend a little bit more.”
Some of the highlights that show continued complexity on the one hand, and common responses on the other, include:
• After a big increase in square footage last year, the numbers remained pretty steady, with the median square footage of 240,410 narrowly under last year’s median of 246,341.
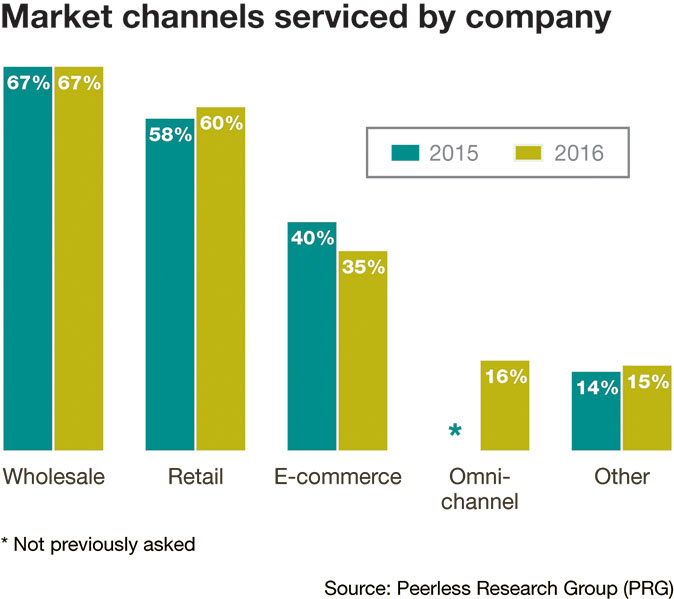
• This was the first year we asked about servicing omni-channel, drawing a 16% response. Another 35% service e-commerce, down 5% from 2015, but when factoring in the omni-channel response, and further dwindling in those who service only one channel (now just 11%), the survey indicates steady growth in e-commerce involvement.
• The average number of employees for a DC held fairly steady at 278 (compared to 287 in 2015) while 21% of operations now have 500 or more employees. This year saw a 4% increase in operations that have 500 to 999 employees.
• When it comes to projected CapEx for the coming year, the average increase was slight, less than 2% growth, but the median climbed by 47.6%.
• In terms of improvement actions, “improving warehouse processes” remains the most common approach, but “improving warehouse IT” climbed from 34% to 41%.
As it has over the years, our annual survey of decision makers for warehouse/DC operations spans multiple areas, including operational trends, use of technology, improvement methods, and company initiatives and experiences in areas such as key operational issues and value-added services performed.
Most participating companies came from manufacturing (39%), followed by distributors (32%), third-party logistics providers (12%) and retailers (6%). Leading verticals included food & grocery, automotive & aerospace, general merchandize, paper products & office supplies, and apparel.
Complexity the norm
After a few years of the survey showing trends including bigger facilities, more workers, less handling of full pallets, more stock keeping units (SKUs), and lately, more inventory turns, most of these factors that make managing DCs challenging remained fairly steady or grew slightly.
In fact, the 2016 survey certainly suggests that complexity is here to stay.
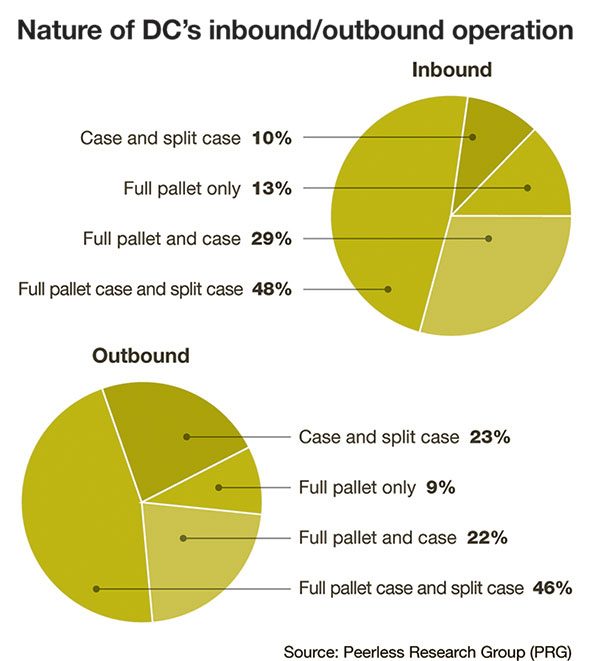
This year, only 9% of respondents handle full pallets on the outbound side, same as 2015’s findings. On the inbound side, full pallet only stood at 13%, a 2% rise from last year. However, those saying that they deal with a mix of full pallet, case, and split case on the inbound grew 4% to 48%.
Overall, 58% of inbound flow involved split cases, and 69% of outbound involved split cases. “This is consistent with last year’s breakout, and reflects both the trend for more frequent and smaller receipts, and the effect of e-commerce,” says Derewecki.
Wholesale (67%) and retail (60%) are the most common channels serviced, with e-commerce serviced by 35% of respondents. While that is lower than last year’s 40% e-commerce response, 16% say they service omni-channel. While there’s likely some overlap between e-commerce and omni-channel responses, just over half of 2016 respondents indicate they service e-commerce and/or omni-channel needs.
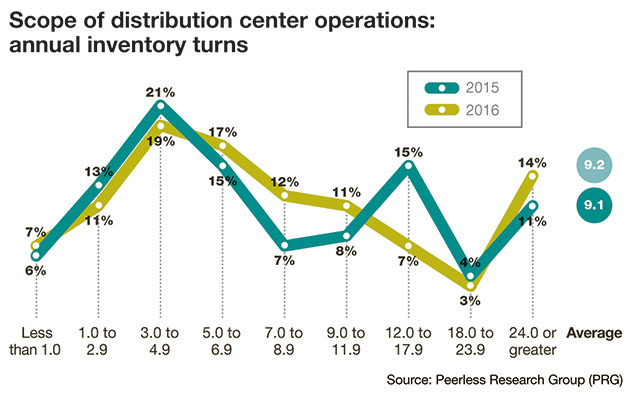
The survey also reflects the inventory challenges of omni-channel and e-commerce support. While the average number of SKUs was down slightly to 13,774, that represents a less than 2% decline from 2015 and remains significantly higher than 2013’s average of 12,916. Average inventory turns, which bumped up to 9.1 last year, climbed slightly to 9.2 for 2016.
At first glance, this slight rise in turns seems positive, but both Saenz and Derewecki believe that there’s room for improvement with turns, because 2016’s response was spotty in certain ranges for number of turns respondents could choose from. For example, only 7% reported turns of between 12 to 18 this year, a drop of 8% from last year. Some ranges did see higher turns, including the highest range of 24 turns or greater, which may indicate more crossdocking, notes Saenz. In a separate question, 35% of respondents said that they use crossdocking, up 2% from last year.
Overall, the turns data, while not headed entirely in the wrong direction, indicates that some companies are perhaps struggling to rationalize SKUs and right-size inventory levels. “Omni-channel SKU proliferation is killing some people,” says Saenz. “Figuring out which SKUs to keep in the mix, and how much to carry, is challenging. To a large extent, it’s a people problem, getting people in merchandizing, marketing, and procurement to figure out what to carry.”
Buildings and labor
With the steady march of e-commerce, it’s not surprising that DCs continue to be large facilities humming with sizeable labor forces.
Total square footage in the network averaged 539,000, down from 570,700. The median dropped as well, but not very much, from 246,341 square feet in 2015 to 240,410. The mega-sized DC network response dropped a bit as well, but the response in the next two ranges grew a point or two.
When it comes to the most common square footage for a single DC, when the network is four buildings or more, the average is 264,445, down a bit from 270,680 square feet in 2015. However, for networks of three buildings or less, the average for the common facility reached 178,090 this year, up from 158,955 in 2015.
In terms of building clear heights, the trend toward higher modern facilities held steady. In fact, the average was up very slightly to 31.1 feet, with 19% of respondents this year having buildings with clear height of 40 feet or higher—even with 2015 and 9% more than in 2014.
The results on size of the DC network continue to reflect scale and complexity. Those saying they have more than three buildings grew slightly to 38%; of these, 28% now have six or more buildings, up from 25% last year. However, the percentage with three buildings declined slightly. According to Saenz and Derewecki, these mixed results likely reflect diverse pressures on industry—to be closer to customers, but to also rationalize DC networks and consolidate into more modern, efficient facilities.
When asked about DC expansion plans, 27% said that they plan to expand square footage, down slightly from 30% last year. There was also a slight downward trend on respondents planning to expand the number and height of buildings, as well as employees. However, expanding employee count remains a common choice (33%) and down just 1% from 2015.
The number of employees in DC operations remained relatively stable, dropping slightly from an average of 287 people last year to 278 this year. However, the 2016 average remains well above the 236 average seen in 2013, and there was some growth in the highest workforce ranges. Specifically, in 2016, 21% of respondents reported employee counts of 500 people or more, up from 16% in 2015.
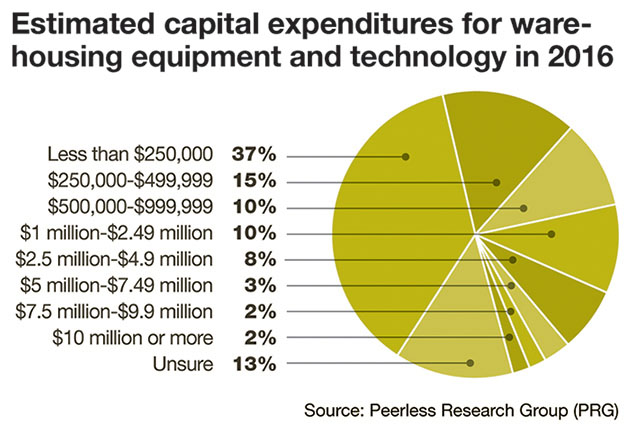
Not only are building and workforce trends staying robust, but so are CapEx plans. The average current CapEx reached $1.37 million, up from $1.21 million last year. Median CapEx declined from $266.13 million last year to $242.95 million this year.
When it comes to CapEx plans for the next year, the average projection is $1.39 million, up very slightly from the previous year’s projected average of $1.35 million, while the median for projections comes to $358.8 million, well above the previous year’s projected median of $314.8 million.
That bump up in median CapEx plans indicates that the more typical operation, not just the big companies, are willing to spend more on DCs. “The fact that the median projected CapEx is up by 47.6% indicates that more of the smaller companies are getting into the game with investments” says Derewecki.
Technology and methods
Investment in software and automated material handling equipment remained relatively stable, while reliance on manual methods continues to ebb. Use of paper-based picking, for example, fell below a 60% response, while use of “parts-to-person” systems like mini-load shuttles and vertical lift modules, first asked about last year, grew from a 5% response to 10%.
Picking technologies, which saw a slight increase, included light-assisted systems, voice assisted with scan verification, and robotic picking, which grew from just 2% last year to 3% this year. However, not all the automation questions showed growth. Use of “automated picking” is down to just 3% this year, from 7% last year, and as high as 11% in 2013.
Derewecki and Saenz observe that some of the drop in automated picking may be related to older, fully automated systems that have not proven flexible enough for today’s e-commerce-driven order profiles. In some cases, the legacy automation may be getting replaced by more semi-automated methods or technologies like parts-to-person systems better able to cope with new order mixes.
“Sometimes, fully automated systems can be less flexible and more of a constraint than an enabler,” says Saenz.
A bright spot for software and IT is found in the survey question about “actions taken” to lower operating costs. Here, “improving warehouse IT” grew from a 34% response last year to 41% this year.
WMS trends continue to bode well for WMS offerings from enterprise resource planning (ERP) vendors, many of which have acquired WMS vendors or steadily enhanced their offerings. In fact, WMS from ERP vendors grew from a 34% response last year to 39% this year, while the response for best-of-breed solutions declined. Respondents also bumped up their use of slotting functionality by 2%.
To some extent, note Derewecki and Saenz, WMS from an ERP vendor may be gaining ground because it typically entails less integration work, but also at play is the fact that some ERP vendors have improved their WMS packages, making their offerings more suitable to a broader range of companies.
“Generally, the ERP vendors have done a good job of improving their WMS offerings, in most cases, by jolting capabilities via acquisitions,” says Saenz.
One technology that has not seen growth is Cloud-based WMS. This year’s survey response saw on-demand/Cloud WMS hold steady at just 3%. “Breaches of IT systems being in the news doesn’t help this technology,” notes Derewecki, “but it may be that Cloud WMS simply has a long ‘gestation’ period because of the long lifespans of WMS.”
This was the first year we asked about “put wall” systems, which drew a 3% response. When combined with slight growth on “light-assisted” picking, light-assisted solutions seem to be seeing some growth. “Put wall systems are becoming very attractive to retailers who are increasing their e-commerce business, so we would expect to see further growth for this technology,” says Saenz.
In another first this year, respondents were asked if they have SKU weights and dimensions in their item masters, drawing a 68% “yes” response. Keeping up with this data is challenging, however, notes Derewecki, since not only are SKUs frequently being added, but suppliers may reconfigure the size or weight of existing SKUs.
The vast majority continue to use some type of productivity metric (82% use metrics, down just 2% from 2015). Common metrics used include units/pieces per hour (40%), orders per hour (30%), cases per hour (29%) and lines per hour 23%. Use of “percent of an engineered standard “dropped slightly, from 19% last year to 17% this year.
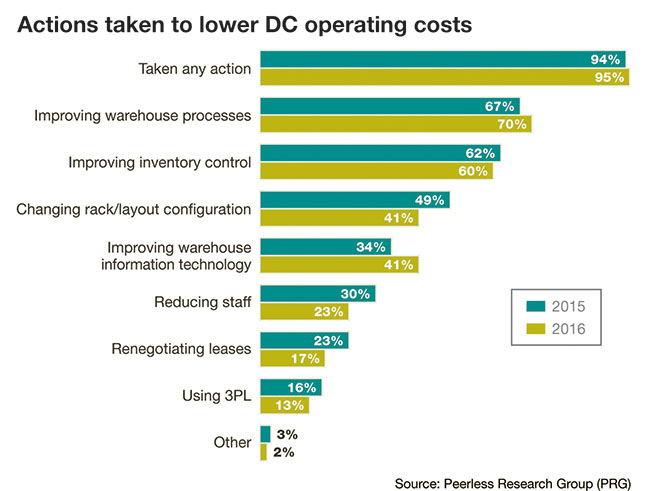
Respondents continue to take a range of actions to lower operating costs, with 95% taking an action of some kind. Common actions include improving warehouse processes (70%) and improving inventory control (60%). Changing of racking and layouts dropped by 8% in 2016, while improving warehouse IT grew 7%.
The greater willingness to apply IT points to companies realizing that they need better information to back up the process and layout tweaks they’ve made the last few years, says Saenz. “Now more companies are looking at their systems to enhance the effort made around process improvements,” he adds.
Major issues
The survey tracks major issues for DC operators, and while the findings remained fairly consistent with last year, one change is that “inability to attract and retain qualified hourly workers” rose from a 39% last year to 41% this year.
The leading challenge was “insufficient space,” holding steady at a 43% response. The third most frequently cited challenge was outdated storage, picking or material handling equipment (which held steady at 34%), followed by inadequate information systems support, cited by 31%, up from 32% last year.
The percentage of respondents who experienced a catastrophic event was just 6% for 2016, down from 17% last year. Some of this might be luck, observes Derewecki, since right after the survey closed, Hurricane Matthew hit the Carolinas.
The vast majority of DCs (89%) continue to offer value-added services to customers, up slightly from 87% last year. While some types of value-added services saw a slight decline, such as grouping/sorting products prior to shipment, and deferred customization, others held steady, and there was a 3% increase in respondents saying that they perform serial number control.
Overall, the survey shows companies are keeping up on investment on DC infrastructure, and incrementally applying more software, IT solutions, and slightly more automation to keep up with the pressures of e-commerce and omni-channel.
At the same time, note Derewecki and Saenz, it’s not as if the survey data shows the floodgates have opened on technology or automation spending. Companies are still trying to manage costs via process tweaks, and are willing to use labor as an inexpensive way to flex capacity.
However, with growing complexity from e-commerce, and some signs that labor rates are beginning to rise in the U.S. market, just relying on process tweaks and labor has its limits.
As Derewecki concludes, “already, many companies have found they need to invest in sophisticated automation to get orders out the door on time. I think that the pressure to apply more automation and have better information system support will intensify in the future as the Baby Boomer generation moves out of the workforce, and DCs have fewer people to draw from.”